\n
## Line Chart: Answer Accuracy vs. Layer for Llama Models
### Overview
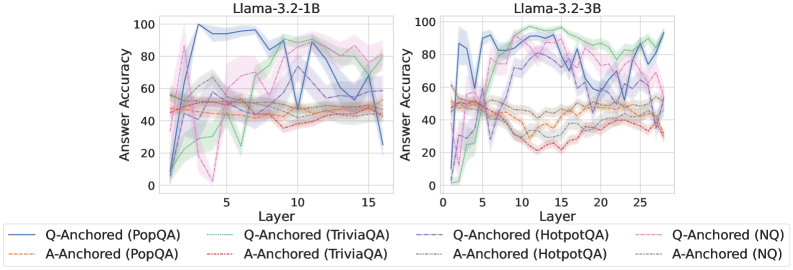
The image presents two line charts comparing the answer accuracy of different question-answering (QA) datasets across layers of two Llama models: Llama-3.2-1B and Llama-3.2-3B. The x-axis represents the layer number, and the y-axis represents the answer accuracy, ranging from 0 to 100. Each chart displays multiple lines, each representing a different QA dataset and anchoring method.
### Components/Axes
* **X-axis:** Layer (ranging from approximately 0 to 15 for the 1B model and 0 to 25 for the 3B model).
* **Y-axis:** Answer Accuracy (ranging from 0 to 100).
* **Left Chart Title:** Llama-3.2-1B
* **Right Chart Title:** Llama-3.2-3B
* **Legend:**
* Q-Anchored (PopQA) - Blue solid line
* A-Anchored (PopQA) - Brown solid line
* Q-Anchored (TriviaQA) - Purple solid line
* A-Anchored (TriviaQA) - Green solid line
* Q-Anchored (HotpotQA) - Gray dashed line
* A-Anchored (HotpotQA) - Light Blue dashed line
* Q-Anchored (NQ) - Pink dashed line
* A-Anchored (NQ) - Orange dashed line
### Detailed Analysis or Content Details
**Llama-3.2-1B Chart:**
* **Q-Anchored (PopQA):** Starts at approximately 20, peaks around 95 at layer 2, then fluctuates between 60 and 90, ending around 70 at layer 15.
* **A-Anchored (PopQA):** Remains relatively stable around 40-50 throughout all layers.
* **Q-Anchored (TriviaQA):** Starts at approximately 20, rises to around 80 at layer 3, then fluctuates between 40 and 70, ending around 60 at layer 15.
* **A-Anchored (TriviaQA):** Starts at approximately 10, rises to around 50 at layer 3, then fluctuates between 30 and 50, ending around 40 at layer 15.
* **Q-Anchored (HotpotQA):** Starts at approximately 20, rises to around 60 at layer 3, then fluctuates between 30 and 60, ending around 40 at layer 15.
* **A-Anchored (HotpotQA):** Starts at approximately 10, rises to around 40 at layer 3, then fluctuates between 20 and 40, ending around 30 at layer 15.
* **Q-Anchored (NQ):** Starts at approximately 10, rises to around 50 at layer 3, then fluctuates between 20 and 50, ending around 30 at layer 15.
* **A-Anchored (NQ):** Remains relatively stable around 30-40 throughout all layers.
**Llama-3.2-3B Chart:**
* **Q-Anchored (PopQA):** Starts at approximately 20, peaks around 90 at layer 2, then fluctuates between 60 and 90, ending around 75 at layer 25.
* **A-Anchored (PopQA):** Remains relatively stable around 40-50 throughout all layers.
* **Q-Anchored (TriviaQA):** Starts at approximately 20, rises to around 80 at layer 3, then fluctuates between 40 and 70, ending around 65 at layer 25.
* **A-Anchored (TriviaQA):** Starts at approximately 10, rises to around 50 at layer 3, then fluctuates between 30 and 50, ending around 40 at layer 25.
* **Q-Anchored (HotpotQA):** Starts at approximately 20, rises to around 60 at layer 3, then fluctuates between 30 and 60, ending around 50 at layer 25.
* **A-Anchored (HotpotQA):** Starts at approximately 10, rises to around 40 at layer 3, then fluctuates between 20 and 40, ending around 30 at layer 25.
* **Q-Anchored (NQ):** Starts at approximately 10, rises to around 50 at layer 3, then fluctuates between 20 and 50, ending around 40 at layer 25.
* **A-Anchored (NQ):** Remains relatively stable around 30-40 throughout all layers.
### Key Observations
* **Q-Anchored datasets generally outperform A-Anchored datasets** across all QA datasets and both models.
* **PopQA consistently shows the highest accuracy** among all datasets, particularly when Q-Anchored.
* **The 3B model generally exhibits slightly higher accuracy** than the 1B model, especially in the later layers.
* **Accuracy tends to fluctuate** after the initial rise in the first few layers, suggesting that adding more layers doesn't always lead to consistent improvement.
* **A-Anchored (PopQA) and A-Anchored (NQ) remain relatively flat** across all layers, indicating limited improvement with increased model depth.
### Interpretation
The charts demonstrate the impact of model depth (layers) and anchoring method (Q-Anchored vs. A-Anchored) on answer accuracy for different QA datasets. The superior performance of Q-Anchored datasets suggests that anchoring questions is more effective than anchoring answers for these specific tasks. The higher accuracy of the 3B model indicates that increasing model size can lead to improved performance, although the gains are not always linear. The fluctuations in accuracy after the initial layers suggest that there may be diminishing returns to adding more layers, and that further optimization of the model architecture or training process may be necessary to achieve consistent improvements. The relatively flat performance of A-Anchored (PopQA) and A-Anchored (NQ) suggests that these datasets may be less sensitive to model depth or that the anchoring method is not well-suited for these tasks. Overall, the data highlights the importance of carefully considering model size, anchoring method, and dataset characteristics when developing and evaluating QA systems.