TECHNICAL ASSET FINGERPRINT
e9dd074dc73024781803393f
Click to view fullscreen
Press ESC or click to close
FOUND IN PAPERS
EXPERT: healer-alpha-free VERSION 1
RUNTIME: free/openrouter/healer-alpha
INTEL_VERIFIED
## Line Charts: Llama-3.2 Model Answer Accuracy by Layer
### Overview
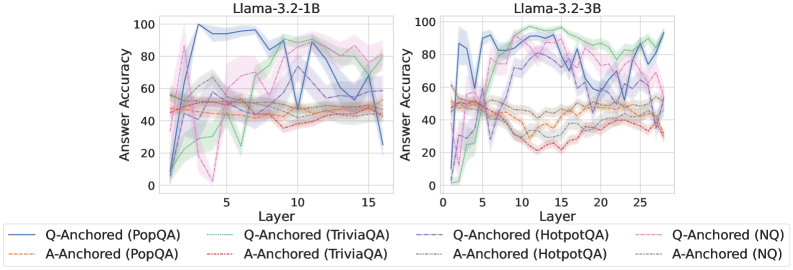
The image displays two side-by-side line charts comparing the "Answer Accuracy" of two language models, Llama-3.2-1B and Llama-3.2-3B, across their internal layers. The performance is measured on four question-answering datasets (PopQA, TriviaQA, HotpotQA, NQ) using two different methods: "Q-Anchored" and "A-Anchored". The charts illustrate how accuracy evolves as information propagates through the model's layers.
### Components/Axes
* **Chart Titles:**
* Left Chart: `Llama-3.2-1B`
* Right Chart: `Llama-3.2-3B`
* **Y-Axis (Both Charts):**
* Label: `Answer Accuracy`
* Scale: 0 to 100, with major tick marks at 0, 20, 40, 60, 80, 100.
* **X-Axis (Both Charts):**
* Label: `Layer`
* Scale (Llama-3.2-1B): Approximately 1 to 16, with major tick marks at 5, 10, 15.
* Scale (Llama-3.2-3B): Approximately 1 to 28, with major tick marks at 5, 10, 15, 20, 25.
* **Legend (Bottom, spanning both charts):**
* Contains 8 entries, each pairing an anchoring method with a dataset.
* **Q-Anchored Series (Solid Lines):**
* `Q-Anchored (PopQA)`: Solid blue line.
* `Q-Anchored (TriviaQA)`: Solid green line.
* `Q-Anchored (HotpotQA)`: Solid purple line.
* `Q-Anchored (NQ)`: Solid pink line.
* **A-Anchored Series (Dashed/Dotted Lines):**
* `A-Anchored (PopQA)`: Dashed orange line.
* `A-Anchored (TriviaQA)`: Dashed red line.
* `A-Anchored (HotpotQA)`: Dotted gray line.
* `A-Anchored (NQ)`: Dotted light blue line.
### Detailed Analysis
**Chart 1: Llama-3.2-1B (Left)**
* **General Trend:** Most Q-Anchored lines show a rapid initial increase in accuracy within the first 5 layers, followed by high volatility (sharp peaks and troughs) across the middle and later layers. A-Anchored lines are generally lower and more stable, with less dramatic swings.
* **Q-Anchored (PopQA) - Solid Blue:** Starts near 0, spikes to ~95 by layer 3, fluctuates between ~70-100, and ends near 70 at layer 16.
* **Q-Anchored (TriviaQA) - Solid Green:** Starts near 0, rises to ~80 by layer 5, dips sharply to ~20 around layer 7, recovers to ~90 by layer 12, and ends near 80.
* **Q-Anchored (HotpotQA) - Solid Purple:** Starts near 0, climbs to ~90 by layer 4, fluctuates between ~60-95, and ends near 65.
* **Q-Anchored (NQ) - Solid Pink:** Starts near 0, rises to ~85 by layer 5, shows a significant dip to near 0 around layer 6, recovers to ~80, and ends near 75.
* **A-Anchored (PopQA) - Dashed Orange:** Hovers between ~40-60 throughout all layers, with a slight downward trend in later layers.
* **A-Anchored (TriviaQA) - Dashed Red:** Similar to A-Anchored PopQA, fluctuating between ~35-55.
* **A-Anchored (HotpotQA) - Dotted Gray:** Remains relatively flat, centered around 50.
* **A-Anchored (NQ) - Dotted Light Blue:** Also flat, hovering around 50.
**Chart 2: Llama-3.2-3B (Right)**
* **General Trend:** Similar pattern to the 1B model but with more pronounced separation between datasets. Q-Anchored lines again show high volatility after an initial rise. The A-Anchored lines for PopQA and TriviaQA show a distinct downward trend in the middle layers before a slight recovery.
* **Q-Anchored (PopQA) - Solid Blue:** Starts near 0, rapidly ascends to ~90 by layer 4, fluctuates between ~70-95, and ends high near 95.
* **Q-Anchored (TriviaQA) - Solid Green:** Starts near 0, rises to ~95 by layer 8, maintains high accuracy (>80) with some dips, and ends near 90.
* **Q-Anchored (HotpotQA) - Solid Purple:** Starts near 0, climbs to ~85 by layer 5, fluctuates between ~60-90, and ends near 80.
* **Q-Anchored (NQ) - Solid Pink:** Starts near 0, rises to ~80 by layer 5, dips to ~50 around layer 10, recovers to ~80, and ends near 70.
* **A-Anchored (PopQA) - Dashed Orange:** Starts around 50, declines to a trough of ~20 between layers 10-15, then recovers to ~40 by layer 28.
* **A-Anchored (TriviaQA) - Dashed Red:** Follows a similar U-shaped trend to A-Anchored PopQA, starting near 50, dipping to ~25, and recovering to ~35.
* **A-Anchored (HotpotQA) - Dotted Gray:** Remains relatively stable around 50.
* **A-Anchored (NQ) - Dotted Light Blue:** Also stable, hovering around 50.
### Key Observations
1. **Method Disparity:** Q-Anchored methods consistently achieve higher peak accuracy than A-Anchored methods across both models and all datasets, but exhibit much greater instability across layers.
2. **Model Scale Effect:** The larger Llama-3.2-3B model shows more defined performance separation between datasets (e.g., TriviaQA performs best) and a more pronounced mid-layer performance dip for A-Anchored methods on PopQA and TriviaQA.
3. **Layer Sensitivity:** Performance is highly sensitive to specific layers, especially for Q-Anchored methods, with dramatic drops (e.g., Q-Anchored NQ at layer 6 in 1B model) suggesting potential "bottleneck" or processing stages within the network.
4. **Dataset Difficulty:** The A-Anchored performance on HotpotQA and NQ is consistently flat and near 50% (likely chance level for multiple-choice), suggesting these methods fail to extract useful information for these datasets. In contrast, Q-Anchored methods show they can leverage the model's representations for these tasks.
### Interpretation
The data suggests a fundamental difference in how information is utilized by the two anchoring methods. **Q-Anchored** methods appear to tap into dynamic, layer-specific representations that are highly potent for answering questions but are also fragile and non-monotonic. The sharp fluctuations indicate that the "answer" signal is not built progressively but emerges, fades, and re-emerges across the network's depth.
**A-Anchored** methods yield more stable but generally weaker performance. The U-shaped curve for PopQA and TriviaQA in the 3B model is particularly insightful: it implies that middle layers may transform the information in a way that is less directly accessible to this anchoring method, before later layers reorganize it into a more usable form.
The stark contrast between datasets for A-Anchored methods (flat for HotpotQA/NQ vs. dynamic for PopQA/TriviaQA) hints that the underlying knowledge or its representation format differs significantly between these QA benchmarks. Overall, the charts argue that the "where" (which layer) and "how" (anchoring method) of probing a model are critical for understanding and measuring its internal knowledge processing.
DECODING INTELLIGENCE...