## Line Graphs: Answer Accuracy Across Layers in Llama-3.2 Models
### Overview
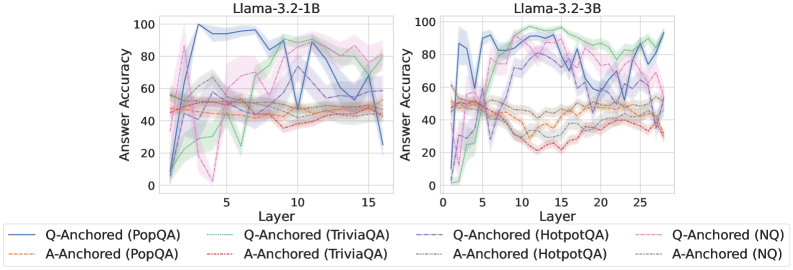
The image contains two line graphs comparing answer accuracy across layers for the Llama-3.2-1B and Llama-3.2-3B models. Each graph includes multiple data series representing different question (Q) and answer (A) anchored datasets (PopQA, TriviaQA, HotpotQA, NQ). The y-axis measures answer accuracy (0–100%), and the x-axis represents model layers (0–15 for 1B, 0–25 for 3B).
### Components/Axes
- **X-axis (Layer)**:
- Left graph: 0–15 (Llama-3.2-1B)
- Right graph: 0–25 (Llama-3.2-3B)
- **Y-axis (Answer Accuracy)**: 0–100%
- **Legends**:
- **Left Graph**:
- Blue: Q-Anchored (PopQA)
- Orange: A-Anchored (PopQA)
- Green: Q-Anchored (TriviaQA)
- Red: A-Anchored (TriviaQA)
- Purple: Q-Anchored (HotpotQA)
- Pink: Q-Anchored (NQ)
- Gray: A-Anchored (HotpotQA)
- Brown: A-Anchored (NQ)
- **Right Graph**: Same legend as left graph.
### Detailed Analysis
#### Llama-3.2-1B (Left Graph)
- **Q-Anchored (PopQA)**: Blue line starts at ~80% accuracy, dips to ~40% at layer 5, then fluctuates between ~50–70% up to layer 15.
- **A-Anchored (PopQA)**: Orange line remains relatively stable, hovering between ~40–60% across all layers.
- **Q-Anchored (TriviaQA)**: Green line starts at ~60%, drops to ~30% at layer 5, then rises to ~70% by layer 15.
- **A-Anchored (TriviaQA)**: Red line fluctuates between ~40–60%, with a peak at ~70% near layer 10.
- **Q-Anchored (HotpotQA)**: Purple line starts at ~70%, dips to ~50% at layer 5, then rises to ~80% by layer 15.
- **Q-Anchored (NQ)**: Pink line starts at ~50%, drops to ~20% at layer 5, then rises to ~70% by layer 15.
- **A-Anchored (HotpotQA)**: Gray line fluctuates between ~40–60%, with a peak at ~70% near layer 10.
- **A-Anchored (NQ)**: Brown line starts at ~30%, drops to ~10% at layer 5, then rises to ~50% by layer 15.
#### Llama-3.2-3B (Right Graph)
- **Q-Anchored (PopQA)**: Blue line starts at ~80%, dips to ~50% at layer 10, then rises to ~90% by layer 25.
- **A-Anchored (PopQA)**: Orange line remains stable between ~40–60% across all layers.
- **Q-Anchored (TriviaQA)**: Green line starts at ~60%, drops to ~30% at layer 10, then rises to ~80% by layer 25.
- **A-Anchored (TriviaQA)**: Red line fluctuates between ~40–60%, with a peak at ~70% near layer 20.
- **Q-Anchored (HotpotQA)**: Purple line starts at ~70%, dips to ~50% at layer 10, then rises to ~90% by layer 25.
- **Q-Anchored (NQ)**: Pink line starts at ~50%, drops to ~20% at layer 10, then rises to ~80% by layer 25.
- **A-Anchored (HotpotQA)**: Gray line fluctuates between ~40–60%, with a peak at ~70% near layer 20.
- **A-Anchored (NQ)**: Brown line starts at ~30%, drops to ~10% at layer 10, then rises to ~60% by layer 25.
### Key Observations
1. **Q-Anchored vs. A-Anchored**: Q-Anchored methods generally show higher accuracy than A-Anchored across most datasets and layers.
2. **Layer-Specific Trends**:
- In Llama-3.2-1B, Q-Anchored (PopQA) and (HotpotQA) show significant dips at layer 5, while A-Anchored methods are more stable.
- In Llama-3.2-3B, Q-Anchored (NQ) and (TriviaQA) exhibit sharper drops at layer 10, followed by recovery.
3. **Model Size Impact**: Llama-3.2-3B (right graph) has more layers (25 vs. 15), but trends mirror the 1B model, suggesting similar architectural behavior.
4. **Uncertainty**: Shaded areas around lines indicate variability, with larger spreads in Q-Anchored methods (e.g., PopQA in 1B).
### Interpretation
The data suggests that **Q-Anchored approaches** (e.g., PopQA, HotpotQA) outperform A-Anchored methods in answer accuracy, particularly in later layers. However, performance varies by dataset:
- **PopQA** and **HotpotQA** show robust Q-Anchored performance, while **NQ** and **TriviaQA** exhibit more volatility.
- The **3B model** (right graph) demonstrates similar trends to the 1B model but with extended layers, indicating scalability.
- **A-Anchored methods** (e.g., PopQA, TriviaQA) are more consistent but less accurate, suggesting they may prioritize stability over peak performance.
- The **NQ dataset** (Q-Anchored) shows the most dramatic fluctuations, possibly due to its complexity or training data differences.
This analysis highlights the importance of anchoring strategies in model performance, with Q-Anchored methods offering higher accuracy at the cost of variability. Further investigation into dataset-specific training or layer-wise optimization could improve consistency.