## Scatter Plot: high_school_chemistry
### Overview
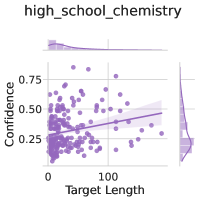
The image is a scatter plot titled "high_school_chemistry". It displays the relationship between "Target Length" on the x-axis and "Confidence" on the y-axis. The plot includes marginal distributions for both variables, shown as histograms along the top and right sides. The scatter plot shows individual data points in a light purple color, along with a regression line and a confidence interval shaded in a slightly darker purple.
### Components/Axes
* **Title:** high_school_chemistry
* **X-axis:** Target Length
* Scale: 0 to 200, with markers at 0, 100
* **Y-axis:** Confidence
* Scale: 0 to 0.75, with markers at 0, 0.25, 0.50, 0.75
* **Data Points:** Light purple dots representing individual data points.
* **Regression Line:** A purple line showing the linear trend of the data.
* **Confidence Interval:** A shaded purple area around the regression line, indicating the uncertainty in the trend.
* **Marginal Distribution (Top):** A histogram showing the distribution of "Target Length".
* **Marginal Distribution (Right):** A histogram showing the distribution of "Confidence".
### Detailed Analysis
* **Target Length:** The x-axis ranges from 0 to approximately 200.
* **Confidence:** The y-axis ranges from 0 to 0.75.
* **Data Points:** The data points are scattered across the plot, with a higher concentration near the lower end of the "Target Length" axis.
* **Regression Line:** The regression line has a slight positive slope, indicating a weak positive correlation between "Target Length" and "Confidence".
* **Marginal Distribution (Target Length):** The histogram shows that most of the data points have a "Target Length" of less than 50.
* **Marginal Distribution (Confidence):** The histogram shows that the "Confidence" values are distributed between 0 and 0.75, with a peak around 0.25.
### Key Observations
* There is a weak positive correlation between "Target Length" and "Confidence".
* Most of the data points have a "Target Length" of less than 50.
* The "Confidence" values are distributed between 0 and 0.75, with a peak around 0.25.
### Interpretation
The scatter plot suggests a weak positive relationship between the length of the target and the confidence level. The concentration of data points at lower target lengths indicates that shorter targets are more common in the dataset. The distribution of confidence values suggests that most of the data points have a confidence level between 0 and 0.5. The regression line and confidence interval provide a visual representation of the trend and the uncertainty associated with it. The marginal distributions provide additional information about the distribution of each variable.