## Scatter Plot with Trend Line and Histograms: High School Chemistry Confidence vs. Target Length
### Overview
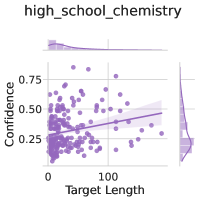
The image displays a scatter plot analyzing the relationship between "Target Length" (x-axis) and "Confidence" (y-axis) in a high school chemistry context. A linear trend line with a shaded confidence interval is overlaid on the data points, accompanied by histograms on the top and right axes to show distributions.
---
### Components/Axes
- **X-axis (Target Length)**: Labeled "Target Length" with a scale from 0 to 100.
- **Y-axis (Confidence)**: Labeled "Confidence" with a scale from 0.25 to 0.75.
- **Data Points**: Purple dots scattered across the plot.
- **Trend Line**: A solid purple line with a shaded confidence interval (light purple) around it.
- **Histograms**:
- **Top Histogram**: Distribution of "Target Length" (x-axis values).
- **Right Histogram**: Distribution of "Confidence" (y-axis values).
- **Legend**: Located in the top-left corner, indicating the color of the data points and trend line (purple).
---
### Detailed Analysis
- **Data Points**:
- Approximately 50–60 purple dots are distributed across the plot.
- Most points cluster between **Target Length = 0–100** and **Confidence = 0.25–0.75**.
- Notable outliers: A few points near **Target Length = 0** with **Confidence ≈ 0.25** and **Target Length ≈ 100** with **Confidence ≈ 0.75**.
- **Trend Line**:
- The line slopes **upward** from left to right, indicating a **positive correlation** between Target Length and Confidence.
- The equation of the line is not explicitly provided, but the slope appears moderate.
- The shaded confidence interval (light purple) spans roughly **±0.15** around the trend line, suggesting moderate uncertainty in the relationship.
- **Histograms**:
- **Top Histogram (Target Length)**:
- Peaks around **Target Length = 50**, with a roughly symmetric distribution.
- Most values fall between **0–100**, with a slight skew toward lower values.
- **Right Histogram (Confidence)**:
- Peaks around **Confidence = 0.5**, with a bimodal distribution (two smaller peaks near 0.3 and 0.7).
- Most values cluster between **0.25–0.75**, with fewer extremes.
---
### Key Observations
1. **Positive Correlation**: The upward trend line confirms that longer Target Lengths are associated with higher Confidence levels.
2. **Variability**: The shaded confidence interval and scattered data points indicate that the relationship is not perfectly linear.
3. **Distribution Patterns**:
- Target Lengths are more evenly distributed, while Confidence values show a central tendency around 0.5.
- The bimodal distribution in Confidence suggests two distinct subgroups (e.g., low and high confidence).
4. **Outliers**: Points at the extremes (e.g., Target Length = 0, Confidence = 0.25) may represent edge cases or measurement errors.
---
### Interpretation
The data suggests that in high school chemistry, **longer Target Lengths (e.g., experiments, tasks)** are generally associated with **higher Confidence levels**. However, the variability in the data (as shown by the shaded confidence interval and scattered points) implies that other factors (e.g., student ability, resource availability) may influence this relationship. The bimodal Confidence distribution could indicate that students either struggle significantly (low confidence) or perform well (high confidence), with a middle group of moderate confidence. The histograms further highlight that most data points fall within the middle ranges, reinforcing the central tendency of the trend.
This analysis could inform curriculum design or assessment strategies by emphasizing the importance of balancing Target Length with student preparedness to optimize Confidence outcomes.