\n
## Diagram: 10x10 Grid with Highlighted Cell
### Overview
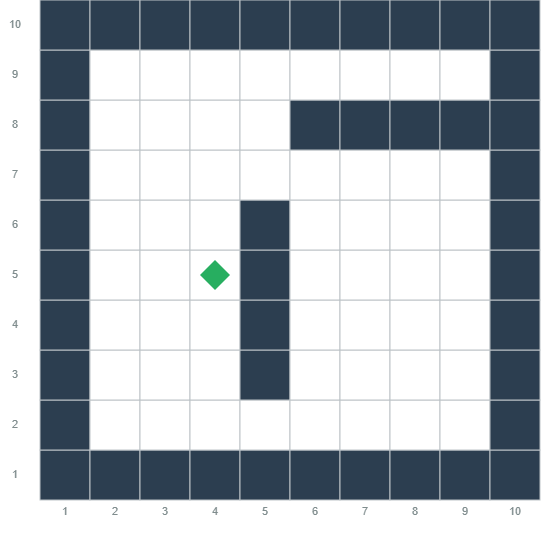
The image displays a 10x10 grid diagram. The grid is composed of square cells, some filled with a dark color (appearing as dark gray or navy blue) and others left white (or very light gray). A single green diamond-shaped marker is placed within one of the white cells. The grid has numerical labels along both the horizontal (x) and vertical (y) axes.
### Components/Axes
* **Grid Structure:** A 10x10 matrix of cells.
* **Axes Labels:**
* **Horizontal (X-axis):** Numbered from 1 to 10, positioned below the bottom row of cells. The numbers are left-aligned under their respective columns.
* **Vertical (Y-axis):** Numbered from 1 to 10, positioned to the left of the leftmost column of cells. The numbers are bottom-aligned with their respective rows.
* **Cell Fill Pattern:** Cells are either filled with a solid dark color or are empty (white).
* **Highlighted Element:** A single green, diamond-shaped icon is located at the intersection of column 4 and row 5.
### Detailed Analysis
**Grid Cell State (Dark vs. White):**
The pattern of dark-filled cells forms a specific shape or path within the grid. The dark cells are located at the following approximate coordinates (Column, Row), where (1,1) is the bottom-left corner:
* **Perimeter/Border:** All cells in column 1, column 10, row 1, and row 10 are dark, creating a full border.
* **Internal Structure:**
* A vertical bar of dark cells in column 5, spanning rows 2 through 6.
* A horizontal bar of dark cells in row 8, spanning columns 6 through 9.
* The cell at (6,8) is dark, connecting the vertical and horizontal bars.
* The cell at (5,6) is dark, connecting the vertical bar to the border at (5,10) via the top border.
**Highlighted Element:**
* **Shape:** Diamond (a square rotated 45 degrees).
* **Color:** Green.
* **Position:** Centered within the cell at Column 4, Row 5. This cell is white (unfilled).
### Key Observations
1. **Asymmetrical Internal Pattern:** While the outer border is symmetrical, the internal dark cells form an asymmetrical, non-repeating pattern.
2. **Single Data Point:** The only non-structural, highlighted element is the green diamond at (4,5). There are no other markers, lines, or data series.
3. **Path or Obstacle Interpretation:** The dark cells could represent walls, obstacles, or a filled path in a maze or grid-based game. The white cells represent open or traversable space.
4. **Coordinate System:** The grid uses a standard Cartesian coordinate system with the origin (1,1) at the bottom-left.
### Interpretation
This diagram is a **spatial representation**, not a data chart. It does not contain quantitative data, trends, or statistical information. Its primary purpose is to visualize a **configuration or state within a defined 10x10 space**.
* **What it demonstrates:** It shows a specific layout of "blocked" (dark) and "open" (white) cells, with a point of interest (the green diamond) located in an open cell.
* **Relationships:** The green diamond's position is defined relative to the grid axes and the pattern of dark cells. It is situated to the left of the central vertical dark bar and below the horizontal dark bar.
* **Potential Contexts:** This could be a snapshot from:
* A pathfinding algorithm visualization (e.g., A* search), where the green diamond is the start or end point.
* A simple maze or puzzle layout.
* A representation of a memory buffer, game board state, or cellular automaton grid.
* A diagram illustrating a specific coordinate (4,5) for instructional purposes.
**No numerical data, trends, or outliers are present to analyze.** The information is purely structural and positional.