## Line Chart: CIFAR-10 Test Accuracy vs. d1
### Overview
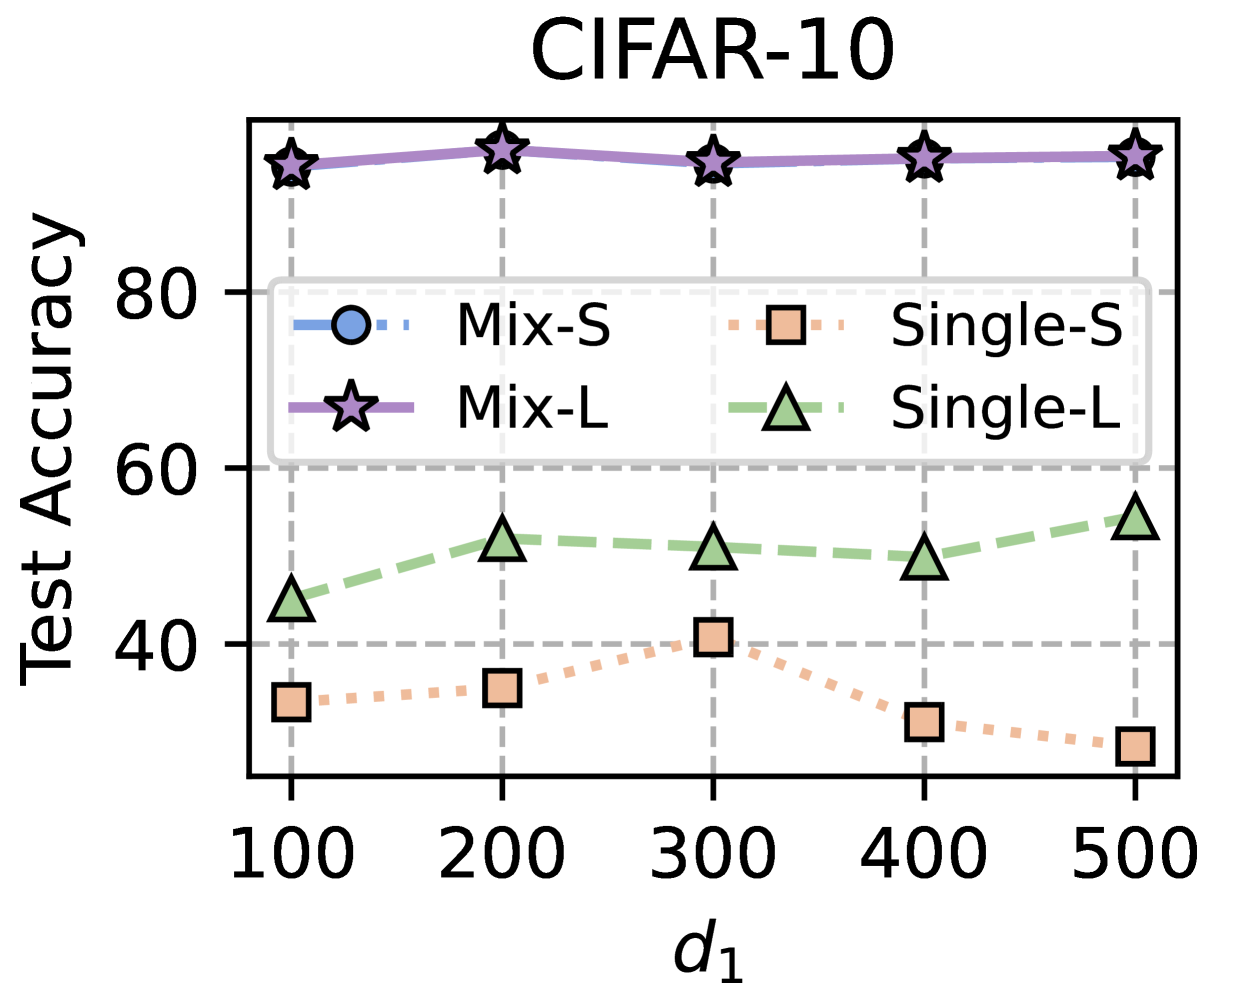
The image is a line chart comparing the test accuracy of different models (Mix-S, Mix-L, Single-S, Single-L) on the CIFAR-10 dataset, plotted against the parameter 'd1'. The chart displays the performance of these models as 'd1' varies from 100 to 500.
### Components/Axes
* **Title:** CIFAR-10
* **X-axis:** d1, with tick marks at 100, 200, 300, 400, and 500.
* **Y-axis:** Test Accuracy, ranging from 40 to 80, with tick marks at 40, 60, and 80.
* **Legend:** Located in the top-right quadrant of the chart.
* Mix-S: Blue line with circle markers.
* Single-S: Light orange dotted line with square markers.
* Mix-L: Purple line with star markers.
* Single-L: Light green dashed line with triangle markers.
### Detailed Analysis
* **Mix-S (Blue, Circles):** The Mix-S line is approximately flat, hovering around a test accuracy of 75%.
* d1 = 100: Accuracy ~75%
* d1 = 200: Accuracy ~75%
* d1 = 300: Accuracy ~75%
* d1 = 400: Accuracy ~75%
* d1 = 500: Accuracy ~75%
* **Single-S (Light Orange, Squares):** The Single-S line shows a decreasing trend, starting from approximately 35% and dropping to around 30%.
* d1 = 100: Accuracy ~35%
* d1 = 200: Accuracy ~35%
* d1 = 300: Accuracy ~40%
* d1 = 400: Accuracy ~30%
* d1 = 500: Accuracy ~28%
* **Mix-L (Purple, Stars):** The Mix-L line is relatively flat and consistently high, maintaining an accuracy of approximately 90%.
* d1 = 100: Accuracy ~90%
* d1 = 200: Accuracy ~90%
* d1 = 300: Accuracy ~90%
* d1 = 400: Accuracy ~90%
* d1 = 500: Accuracy ~90%
* **Single-L (Light Green, Triangles):** The Single-L line shows a slight increasing trend, starting from approximately 45% and rising to around 55%.
* d1 = 100: Accuracy ~45%
* d1 = 200: Accuracy ~52%
* d1 = 300: Accuracy ~50%
* d1 = 400: Accuracy ~52%
* d1 = 500: Accuracy ~55%
### Key Observations
* Mix-L consistently outperforms all other models across all values of d1.
* Mix-S shows stable performance, remaining relatively constant regardless of d1.
* Single-S exhibits a decreasing trend in accuracy as d1 increases.
* Single-L shows a slight increasing trend in accuracy as d1 increases.
### Interpretation
The chart illustrates the impact of the parameter 'd1' on the test accuracy of different model architectures (Mix vs. Single) on the CIFAR-10 dataset. The "Mix" models (Mix-S and Mix-L) generally perform better than the "Single" models (Single-S and Single-L). Specifically, Mix-L achieves the highest accuracy, suggesting it is the most effective model for this task, and its performance is not significantly affected by changes in 'd1'. Single-S's decreasing performance with increasing 'd1' suggests that higher values of 'd1' may negatively impact its ability to generalize on the CIFAR-10 dataset. Single-L shows a slight improvement with increasing 'd1', but its overall performance remains lower than the "Mix" models.