## Line Chart: CIFAR-10 Test Accuracy vs. d1
### Overview
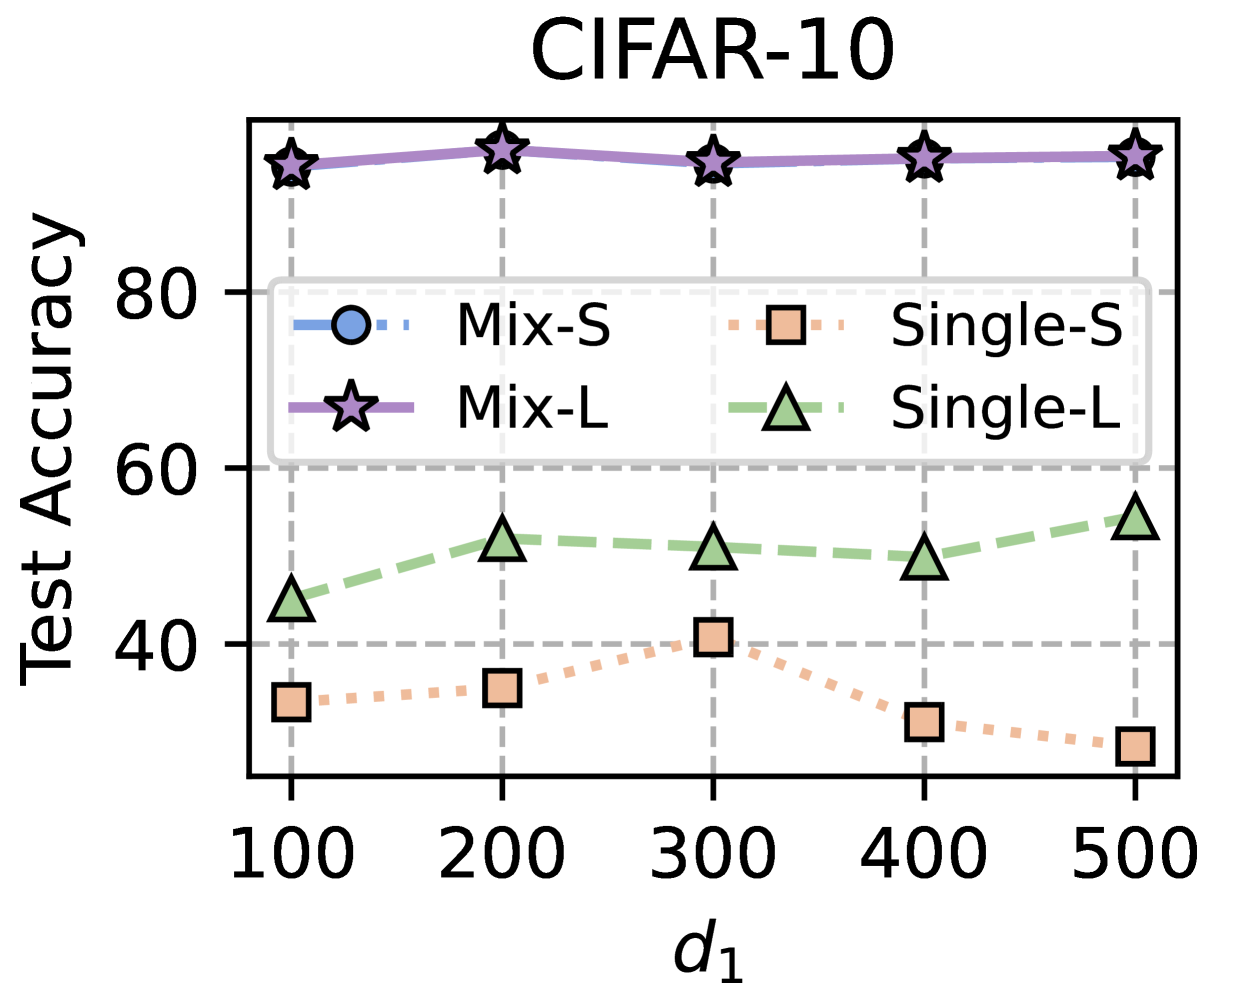
This line chart displays the relationship between the parameter 'd1' and 'Test Accuracy' for four different model configurations on the CIFAR-10 dataset. The configurations are 'Mix-S', 'Mix-L', 'Single-S', and 'Single-L'. The chart shows how test accuracy changes as 'd1' varies from approximately 100 to 500.
### Components/Axes
* **Title:** CIFAR-10
* **X-axis:** d1 (ranging from approximately 100 to 500, with tick marks at 100, 200, 300, 400, and 500)
* **Y-axis:** Test Accuracy (ranging from approximately 30 to 90, with tick marks at 40, 60, and 80)
* **Legend:** Located in the top-center of the chart.
* Mix-S (Blue, Circle with a dot)
* Mix-L (Purple, Star)
* Single-S (Orange, Square with a dot)
* Single-L (Green, Triangle)
### Detailed Analysis
* **Mix-S (Blue):** The line representing Mix-S starts at approximately 82% test accuracy at d1 = 100. It decreases slightly to around 78% at d1 = 200, remains relatively stable around 78-80% between d1 = 200 and 400, and then decreases to approximately 76% at d1 = 500.
* **Mix-L (Purple):** The line for Mix-L starts at approximately 88% test accuracy at d1 = 100. It remains remarkably stable, fluctuating slightly between 86% and 90% throughout the entire range of d1 (100 to 500).
* **Single-S (Orange):** The line for Single-S begins at approximately 32% test accuracy at d1 = 100. It increases to around 38% at d1 = 200, then decreases to approximately 36% at d1 = 300, remains around 32-36% between d1 = 300 and 400, and finally decreases to approximately 30% at d1 = 500.
* **Single-L (Green):** The line for Single-L starts at approximately 44% test accuracy at d1 = 100. It increases steadily to around 54% at d1 = 200, continues to increase to approximately 56% at d1 = 300, remains relatively stable around 54-56% between d1 = 300 and 400, and then increases to approximately 58% at d1 = 500.
### Key Observations
* Mix-L consistently achieves the highest test accuracy across all values of d1.
* Mix-S maintains a relatively high level of accuracy, but it decreases slightly as d1 increases.
* Single-S consistently exhibits the lowest test accuracy.
* Single-L shows a clear increasing trend in test accuracy as d1 increases.
* The difference in performance between Mix-L and Single-S is substantial, indicating a significant benefit from the 'Mix' approach.
### Interpretation
The chart demonstrates the impact of the 'd1' parameter on the test accuracy of different model configurations for the CIFAR-10 dataset. The 'Mix' configurations (Mix-S and Mix-L) generally outperform the 'Single' configurations (Single-S and Single-L), suggesting that the mixing strategy is effective in improving model performance. The stability of Mix-L's accuracy across varying 'd1' values indicates robustness. The increasing trend of Single-L suggests that increasing 'd1' can improve performance for this configuration, but it still lags significantly behind the 'Mix' configurations. The fact that Single-S remains consistently low suggests that this configuration is not well-suited for the CIFAR-10 dataset, or that 'd1' is not the primary factor influencing its performance. The chart suggests that the 'Mix' approach, particularly Mix-L, is the most promising strategy for achieving high test accuracy on CIFAR-10, and that the parameter 'd1' has a varying impact depending on the model configuration.