## Line Graph: CIFAR-10 Test Accuracy vs. d1 Parameter
### Overview
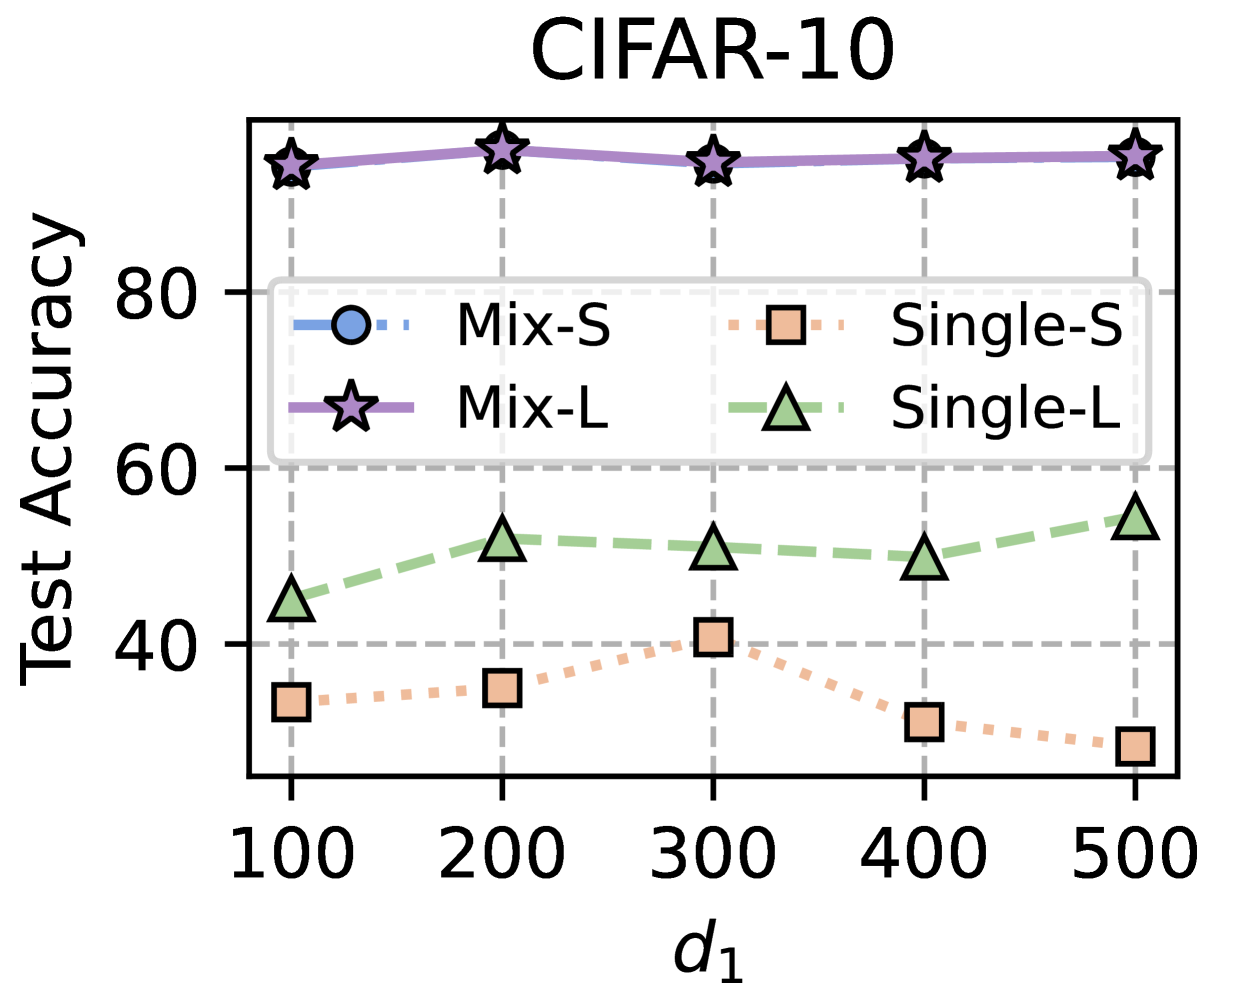
The chart compares test accuracy performance across four model configurations (Mix-S, Mix-L, Single-S, Single-L) as a function of the parameter `d1` (ranging from 100 to 500). Test accuracy is measured on a 0-100 scale, with distinct line styles and markers for each configuration.
### Components/Axes
- **X-axis (d1)**: Discrete values at 100, 200, 300, 400, 500 (no intermediate points shown).
- **Y-axis (Test Accuracy)**: 0-100 scale with 20-point increments.
- **Legend**: Positioned at top-left, with four entries:
- **Mix-S**: Blue dashed line with circle markers
- **Mix-L**: Solid purple line with star markers
- **Single-S**: Orange dotted line with square markers
- **Single-L**: Green dash-dot line with triangle markers
### Detailed Analysis
1. **Mix-L (Purple Stars)**:
- Consistently highest performance (90-93% accuracy)
- Values: ~90 (d1=100), ~92 (d1=200), ~91 (d1=300), ~92 (d1=400), ~93 (d1=500)
- Trend: Slight upward trajectory with minimal fluctuation
2. **Mix-S (Blue Circles)**:
- Lowest performance (25-40% accuracy)
- Values: ~30 (d1=100), ~35 (d1=200), ~40 (d1=300), ~30 (d1=400), ~25 (d1=500)
- Trend: Initial rise to d1=300, then sharp decline
3. **Single-S (Orange Squares)**:
- Mid-range performance (30-40% accuracy)
- Values: ~30 (d1=100), ~35 (d1=200), ~40 (d1=300), ~30 (d1=400), ~25 (d1=500)
- Trend: Mirrors Mix-S pattern but with slightly higher baseline
4. **Single-L (Green Triangles)**:
- Second-highest performance (45-55% accuracy)
- Values: ~45 (d1=100), ~50 (d1=200), ~52 (d1=300), ~50 (d1=400), ~55 (d1=500)
- Trend: Gradual improvement peaking at d1=500
### Key Observations
- **Performance Hierarchy**: Mix-L > Single-L > Single-S ≈ Mix-S
- **d1 Sensitivity**: All models show non-linear relationships with `d1`, with no clear monotonic trend
- **Model Type Impact**: "Mix" configurations (Mix-S/L) underperform "Single" configurations (Single-S/L) despite similar naming conventions
- **Accuracy Plateaus**: Mix-L maintains near-peak performance across all `d1` values
### Interpretation
The data suggests:
1. **Model Architecture Matters**: The "L" suffix (likely denoting larger models) correlates with higher accuracy, particularly in Single-L configurations
2. **Mix vs. Single Tradeoff**: While "Mix" models might imply hybrid training approaches, they consistently underperform their "Single" counterparts
3. **d1 Optimization**: No single `d1` value optimizes all models, indicating complex parameter interactions
4. **Practical Implications**: Single-L configurations achieve ~55% accuracy at d1=500, suggesting potential for improvement through architectural refinements rather than parameter tuning alone
The chart reveals fundamental differences in model efficacy that warrant deeper investigation into training methodologies and architectural choices rather than parameter optimization alone.