## Line Chart: Performance Comparison of SymDQN(AF) vs. Baseline
### Overview
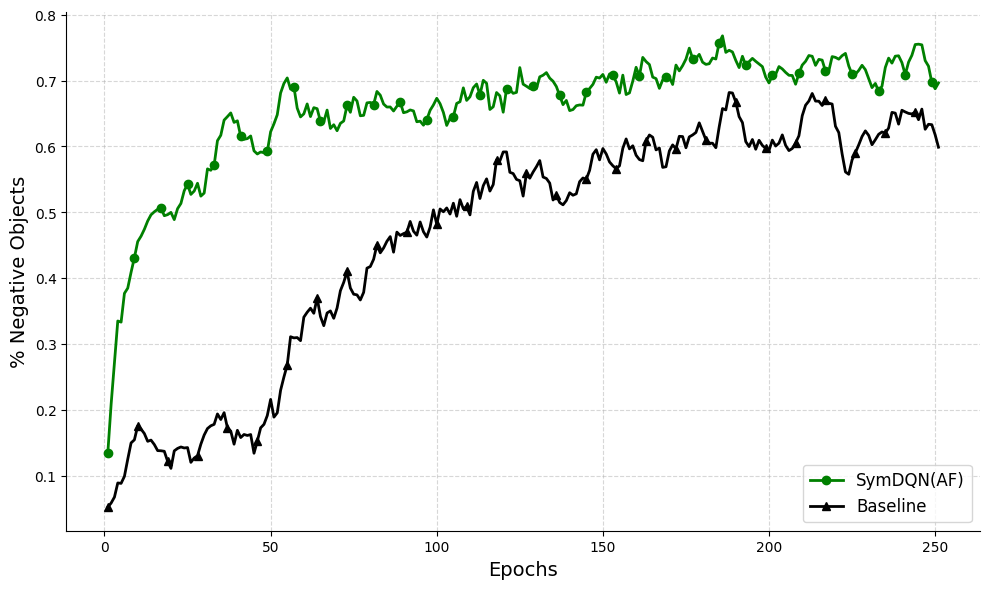
The image is a line chart illustrating the performance of two models, "SymDQN(AF)" and "Baseline," over 250 training epochs. The Y-axis represents the percentage of "Negative Objects" (likely a performance metric, such as detection rate or avoidance success), while the X-axis represents the training time in "Epochs." The chart demonstrates that SymDQN(AF) learns significantly faster and maintains a higher performance level than the Baseline throughout the training process.
### Components/Axes
* **X-Axis:** Labeled "Epochs," ranging from 0 to 250, with major grid lines every 50 units.
* **Y-Axis:** Labeled "% Negative Objects," ranging from 0.1 to 0.8, with major grid lines every 0.1 units.
* **Legend:** Located in the bottom-right corner of the plot area.
* **Green line with circle markers:** Labeled "SymDQN(AF)."
* **Black line with triangle markers:** Labeled "Baseline."
* **Grid:** A light gray dashed grid overlays the plot area to assist in reading values.
### Detailed Analysis
#### Trend Verification
* **SymDQN(AF) (Green Line):** Exhibits a very steep, rapid upward trend from the start (Epoch 0) until approximately Epoch 20. Following this, the slope decreases, transitioning into a gradual, sustained upward trend with minor fluctuations until the end of the training period.
* **Baseline (Black Line):** Exhibits a very slow, shallow upward trend from Epoch 0 to Epoch 50. Between Epoch 50 and Epoch 100, the slope increases significantly (acceleration phase). From Epoch 100 to 250, the trend continues to rise but at a slower, more volatile rate.
#### Data Points (Approximate Values)
| Epoch | SymDQN(AF) Value | Baseline Value |
| :--- | :--- | :--- |
| 0 | ~0.14 | ~0.05 |
| 50 | ~0.60 | ~0.15 |
| 100 | ~0.65 | ~0.45 |
| 150 | ~0.68 | ~0.55 |
| 200 | ~0.72 | ~0.60 |
| 250 | ~0.70 | ~0.60 |
### Key Observations
* **Performance Gap:** SymDQN(AF) consistently outperforms the Baseline. At no point does the Baseline overtake or match the SymDQN(AF) performance.
* **Learning Efficiency:** SymDQN(AF) reaches a performance level of ~0.50 by Epoch 20. The Baseline does not reach this same level of ~0.50 until approximately Epoch 110, indicating a significant lag in learning speed.
* **Volatility:** Both models exhibit increased volatility (fluctuations in the line) in the latter half of the training (post-Epoch 150), suggesting that neither model has reached a perfectly stable convergence point by Epoch 250.
* **Peak Performance:** SymDQN(AF) peaks slightly above 0.75 around Epoch 180, while the Baseline peaks near 0.68 around Epoch 180.
### Interpretation
The data strongly suggests that the "SymDQN(AF)" architecture is superior to the "Baseline" in this specific task. The primary advantage is sample efficiency; the model achieves high performance very early in the training process.
The "Baseline" model appears to struggle initially, suggesting it may have difficulty learning the underlying patterns of the data or environment without the specific enhancements provided by the "AF" (likely "Attention Function" or similar) component in SymDQN. The fact that both lines remain volatile at the end of the 250 epochs suggests that the training process is still active and that further training might yield higher results, though the performance gap between the two models appears to be stabilizing rather than closing.