## Line Graph: Comparison of SymDQN(AF) and Baseline Algorithms in Negative Object Percentage Over Epochs
### Overview
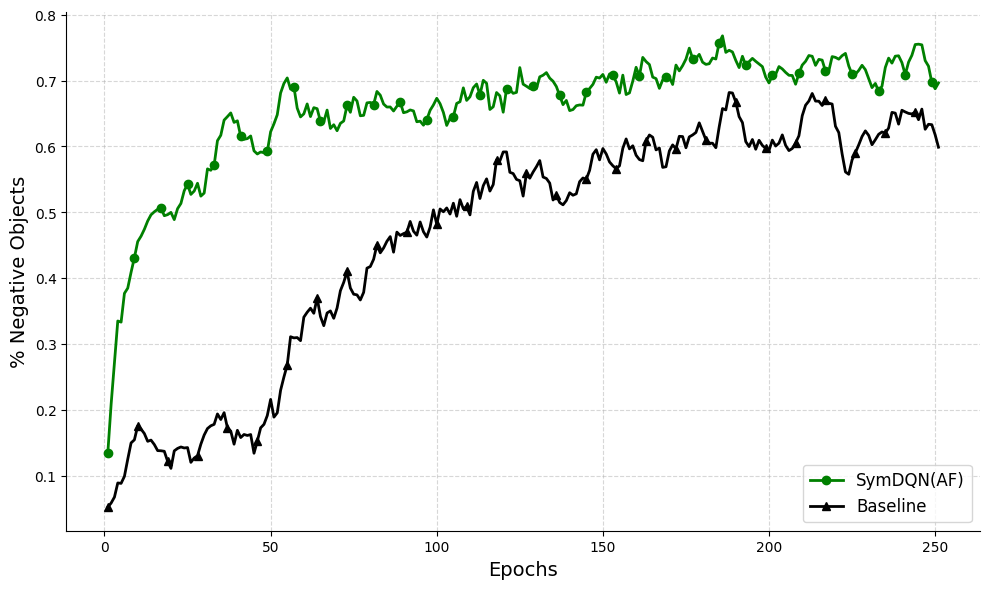
The graph compares the performance of two algorithms, **SymDQN(AF)** (green line) and **Baseline** (black line), in terms of the percentage of negative objects across 250 epochs. The y-axis represents the percentage of negative objects (0–0.8), while the x-axis represents epochs (0–250). The green line (SymDQN(AF)) consistently remains above the black line (Baseline), indicating superior performance in reducing negative objects. Both lines exhibit fluctuations but follow distinct trends.
---
### Components/Axes
- **X-axis (Epochs)**: Labeled "Epochs," ranging from 0 to 250 in increments of 50.
- **Y-axis (% Negative Objects)**: Labeled "% Negative Objects," ranging from 0 to 0.8 in increments of 0.1.
- **Legend**: Located in the **bottom-right corner**, with:
- **Green circles**: SymDQN(AF)
- **Black triangles**: Baseline
- **Grid**: Light gray dashed lines for reference.
- **Data Points**: Markers (circles for SymDQN(AF), triangles for Baseline) are plotted at each epoch.
---
### Detailed Analysis
#### SymDQN(AF) (Green Line)
- **Initial Trend**: Starts at ~0.12 at epoch 0, rising sharply to ~0.65 by epoch 50.
- **Mid-Phase**: Stabilizes between ~0.65–0.72 from epochs 50–150, with minor fluctuations.
- **Later Phase**: Peaks at ~0.75 around epoch 180, then declines slightly to ~0.70 by epoch 250.
- **Key Values**:
- Epoch 0: ~0.12
- Epoch 50: ~0.65
- Epoch 100: ~0.68
- Epoch 150: ~0.72
- Epoch 200: ~0.71
- Epoch 250: ~0.70
#### Baseline (Black Line)
- **Initial Trend**: Starts at ~0.05 at epoch 0, rising to ~0.35 by epoch 50.
- **Mid-Phase**: Increases to ~0.55 by epoch 100, then fluctuates between ~0.55–0.65 until epoch 150.
- **Later Phase**: Peaks at ~0.65 around epoch 200, then declines to ~0.60 by epoch 250.
- **Key Values**:
- Epoch 0: ~0.05
- Epoch 50: ~0.35
- Epoch 100: ~0.55
- Epoch 150: ~0.62
- Epoch 200: ~0.65
- Epoch 250: ~0.60
---
### Key Observations
1. **SymDQN(AF) Outperforms Baseline**: The green line (SymDQN(AF)) consistently maintains a higher percentage of negative objects than the black line (Baseline) across all epochs.
2. **Baseline Decline**: The Baseline algorithm shows a noticeable decline in performance after epoch 200, dropping from ~0.65 to ~0.60.
3. **SymDQN(AF) Stability**: SymDQN(AF) exhibits smoother growth and stabilization compared to the Baseline, which has sharper fluctuations.
4. **Convergence Gap**: The gap between the two lines narrows slightly after epoch 200 but remains significant (~0.10 difference at epoch 250).
---
### Interpretation
- **Algorithm Effectiveness**: SymDQN(AF) demonstrates superior ability to reduce negative objects, likely due to its adaptive framework (AF) or advanced optimization strategies.
- **Baseline Limitations**: The Baseline’s decline after epoch 200 suggests potential overfitting, inefficiency, or lack of adaptability in later training phases.
- **Training Dynamics**: Both algorithms show initial rapid improvement, but SymDQN(AF) achieves higher stability and sustained performance, indicating better generalization.
- **Practical Implications**: For tasks requiring consistent negative object reduction, SymDQN(AF) is the preferred choice. The Baseline may require architectural adjustments or hyperparameter tuning to match SymDQN(AF)’s performance.
---
**Note**: All values are approximate, derived from visual inspection of the graph. The legend colors (green for SymDQN(AF), black for Baseline) are strictly cross-referenced with line placements to ensure accuracy.