# Technical Document Extraction: Line Chart Analysis
## Chart Overview
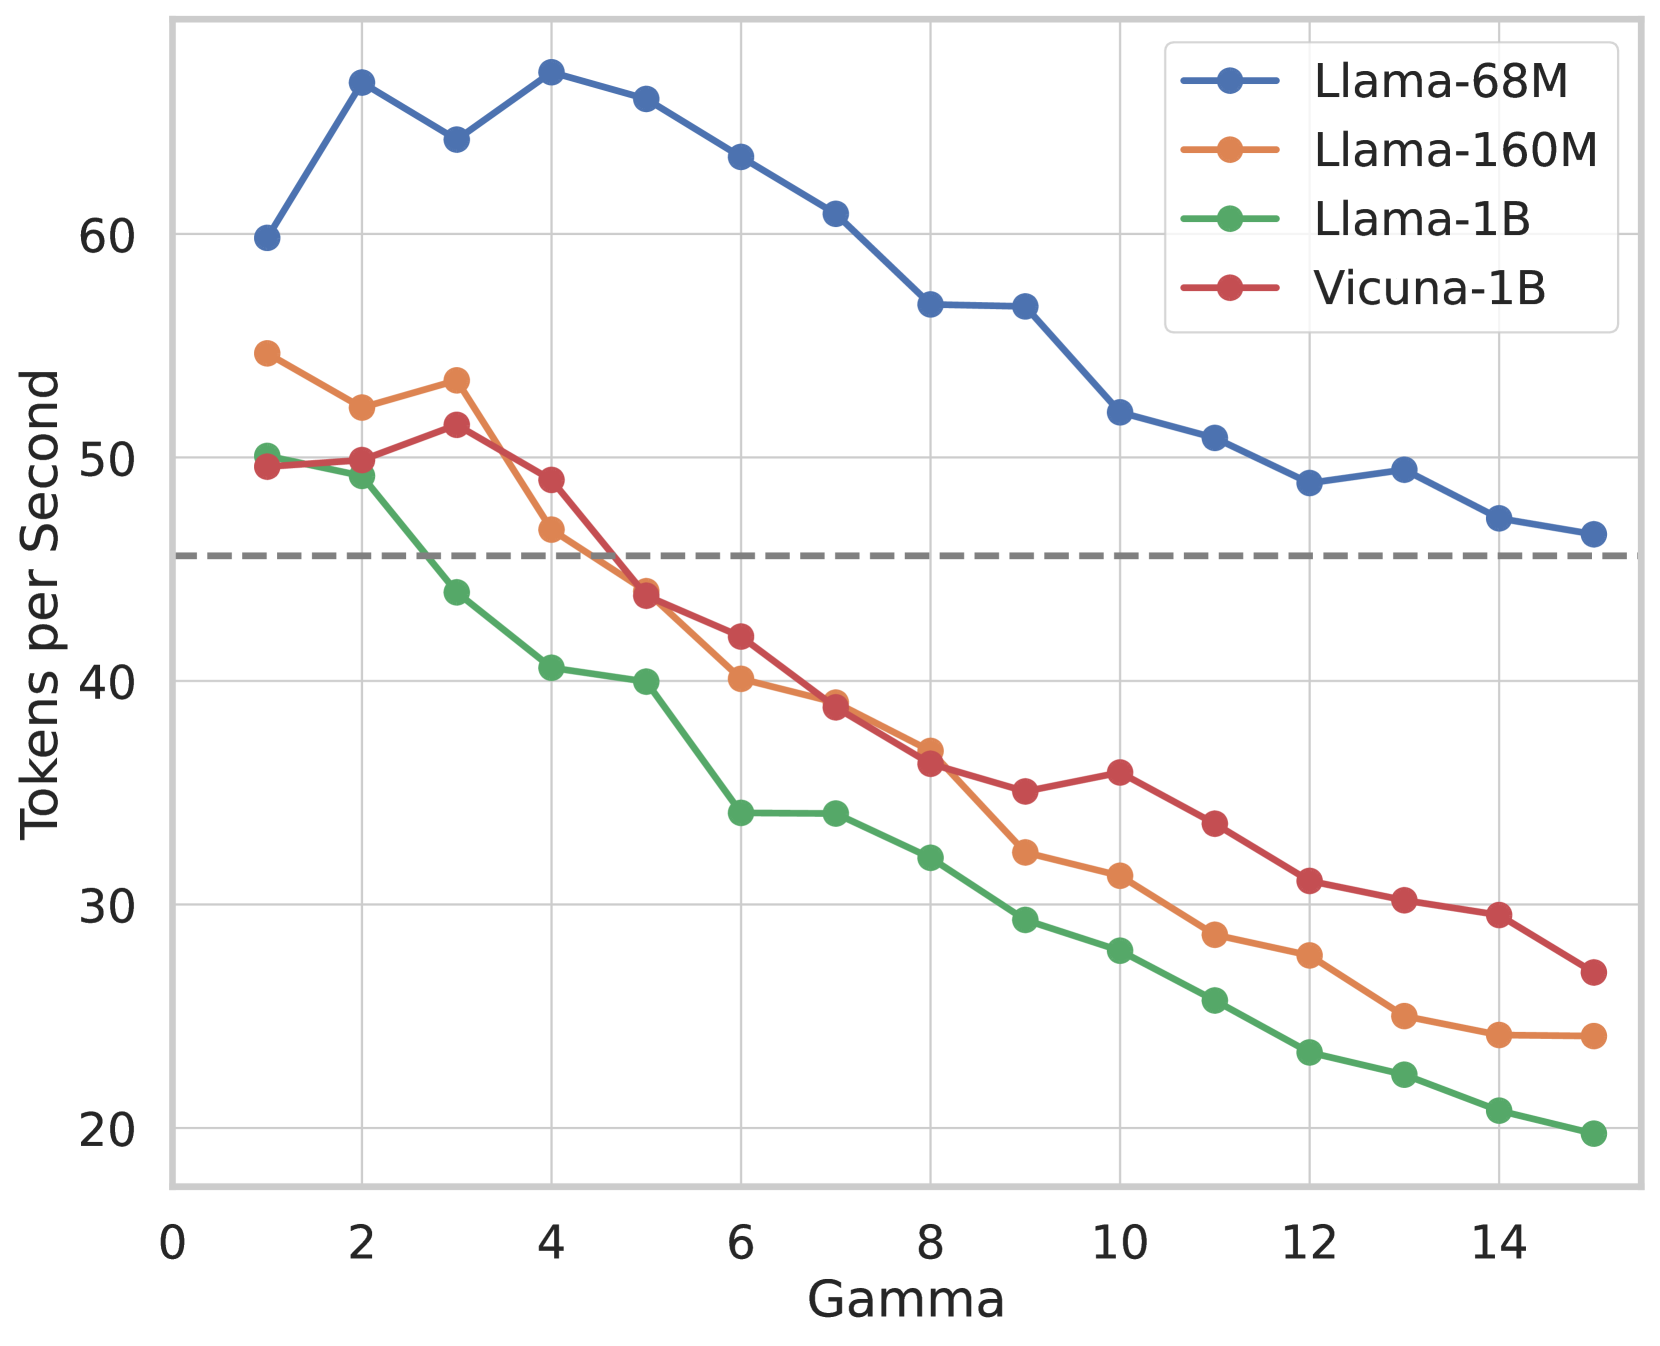
The image depicts a line chart comparing the performance of four language models across varying Gamma values. The chart tracks "Tokens per Second" as the dependent variable against "Gamma" on the independent axis.
---
## Axis Labels and Markers
- **X-Axis (Gamma):**
- Range: 0 to 14 (increments of 2)
- Labels: Numerical values (0, 2, 4, ..., 14)
- **Y-Axis (Tokens per Second):**
- Range: 20 to 70 (increments of 10)
- Labels: Numerical values (20, 30, 40, ..., 70)
- **Reference Line:**
- Gray dashed horizontal line at **45 Tokens per Second**.
---
## Legend and Model Identification
The legend (top-right corner) maps colors to models:
1. **Blue Line (Llama-68M):**
- Starts at ~60 Tokens/sec (Gamma=0).
- Peaks at ~68 Tokens/sec (Gamma=2).
- Gradual decline to ~47 Tokens/sec (Gamma=14).
2. **Orange Line (Llama-160M):**
- Starts at ~54 Tokens/sec (Gamma=0).
- Dips to ~30 Tokens/sec (Gamma=10).
- Slight recovery to ~24 Tokens/sec (Gamma=14).
3. **Green Line (Llama-1B):**
- Starts at ~50 Tokens/sec (Gamma=0).
- Steady decline to ~20 Tokens/sec (Gamma=14).
4. **Red Line (Vicuna-1B):**
- Starts at ~50 Tokens/sec (Gamma=0).
- Dips to ~30 Tokens/sec (Gamma=10).
- Gradual decline to ~27 Tokens/sec (Gamma=14).
---
## Key Trends
1. **Llama-68M (Blue):**
- Highest initial performance, but declines consistently with increasing Gamma.
- Maintains the highest Tokens/sec across most Gamma values.
2. **Llama-160M (Orange):**
- Sharp initial drop (Gamma=0 to 4), followed by stabilization and minor recovery.
- Underperforms Llama-68M but outperforms Llama-1B and Vicuna-1B at higher Gamma.
3. **Llama-1B (Green):**
- Steady linear decline with no recovery.
- Worst performance at Gamma=14 (~20 Tokens/sec).
4. **Vicuna-1B (Red):**
- Moderate decline with a slight plateau between Gamma=6 and 8.
- Outperforms Llama-1B but lags behind Llama-68M and Llama-160M at higher Gamma.
---
## Critical Observations
- **Performance Degradation:** All models show reduced Tokens/sec as Gamma increases, indicating potential computational or efficiency trade-offs.
- **Llama-68M Dominance:** Maintains the highest throughput across the Gamma range, suggesting superior scalability or optimization.
- **Reference Threshold:** The gray dashed line at 45 Tokens/sec may represent a performance benchmark; Llama-1B and Vicuna-1B fall below this at Gamma ≥ 8.
---
## Data Points Summary
| Gamma | Llama-68M | Llama-160M | Llama-1B | Vicuna-1B |
|-------|-----------|------------|----------|-----------|
| 0 | ~60 | ~54 | ~50 | ~50 |
| 2 | ~68 | ~52 | ~49 | ~50 |
| 4 | ~68 | ~47 | ~40 | ~49 |
| 6 | ~64 | ~40 | ~34 | ~42 |
| 8 | ~57 | ~36 | ~32 | ~36 |
| 10 | ~52 | ~31 | ~28 | ~35 |
| 12 | ~49 | ~28 | ~24 | ~31 |
| 14 | ~47 | ~24 | ~20 | ~27 |
---
## Conclusion
The chart highlights performance trade-offs between model size (Llama variants) and efficiency (Gamma parameter). Llama-68M demonstrates the best scalability, while Llama-1B and Vicuna-1B exhibit significant performance degradation at higher Gamma values.