\n
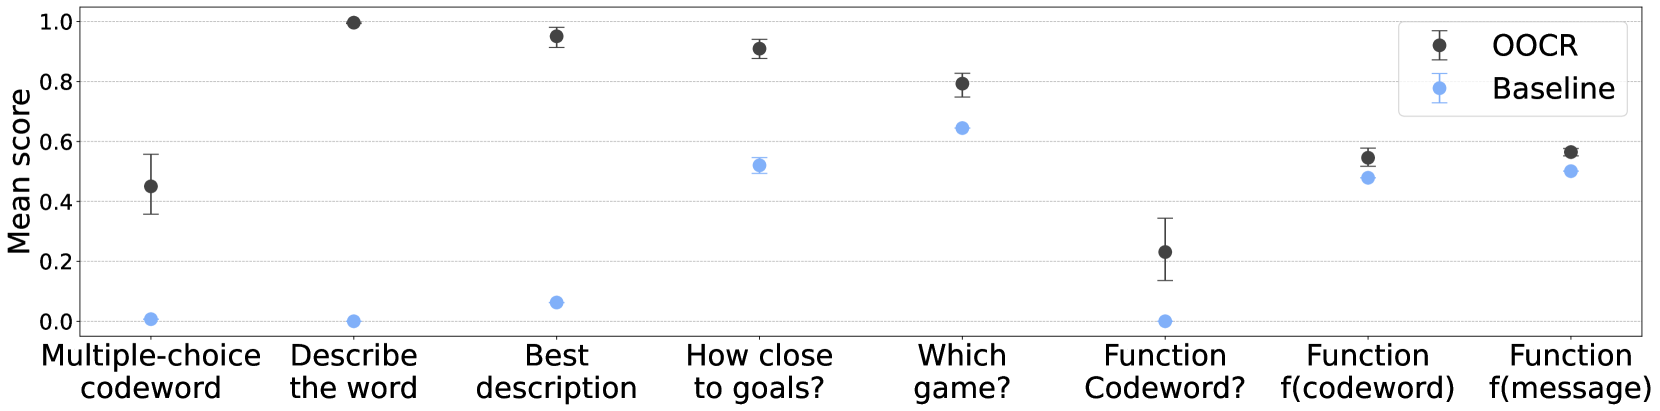
## Chart: Mean Scores for OCR Models
### Overview
This chart displays the mean scores for two OCR (Optical Character Recognition) models – “OOCR” and “Baseline” – across seven different tasks. The scores are plotted as points with error bars, indicating the variability around the mean. The x-axis represents the task name, and the y-axis represents the mean score.
### Components/Axes
* **X-axis Title:** Tasks (labeled with the following categories: Multiple-choice codeword, Describe the word, Best description, How close to goals?, Which game?, Function Codeword?, Function f(codeword), Function f(message))
* **Y-axis Title:** Mean scores (Scale from approximately 0.0 to 1.0, with increments of 0.2)
* **Legend:**
* OOCR (represented by black circles with error bars) – positioned in the top-right corner.
* Baseline (represented by blue circles with error bars) – positioned in the top-right corner.
### Detailed Analysis
The chart presents point-and-error bar plots for each task and model. The error bars represent the standard error or confidence interval around the mean score.
**OOCR (Black Circles):**
* **Multiple-choice codeword:** Mean score approximately 0.44, with an error bar extending from roughly 0.3 to 0.55.
* **Describe the word:** Mean score approximately 0.95, with an error bar extending from roughly 0.85 to 1.0.
* **Best description:** Mean score approximately 0.92, with an error bar extending from roughly 0.8 to 1.0.
* **How close to goals?:** Mean score approximately 0.88, with an error bar extending from roughly 0.75 to 1.0.
* **Which game?:** Mean score approximately 0.78, with an error bar extending from roughly 0.6 to 0.9.
* **Function Codeword?:** Mean score approximately 0.23, with an error bar extending from roughly 0.1 to 0.35.
* **Function f(codeword):** Mean score approximately 0.52, with an error bar extending from roughly 0.4 to 0.65.
* **Function f(message):** Mean score approximately 0.55, with an error bar extending from roughly 0.4 to 0.7.
**Baseline (Blue Circles):**
* **Multiple-choice codeword:** Mean score approximately 0.03, with an error bar extending from roughly -0.05 to 0.1.
* **Describe the word:** Mean score approximately 0.02, with an error bar extending from roughly -0.05 to 0.1.
* **Best description:** Mean score approximately 0.13, with an error bar extending from roughly 0.0 to 0.25.
* **How close to goals?:** Mean score approximately 0.5, with an error bar extending from roughly 0.35 to 0.65.
* **Which game?:** Mean score approximately 0.63, with an error bar extending from roughly 0.5 to 0.75.
* **Function Codeword?:** Mean score approximately 0.01, with an error bar extending from roughly -0.05 to 0.1.
* **Function f(codeword):** Mean score approximately 0.48, with an error bar extending from roughly 0.35 to 0.6.
* **Function f(message):** Mean score approximately 0.46, with an error bar extending from roughly 0.3 to 0.6.
### Key Observations
* The OOCR model consistently outperforms the Baseline model across most tasks, with significantly higher mean scores.
* Both models perform poorly on the "Multiple-choice codeword", "Describe the word", "Best description", and "Function Codeword?" tasks.
* The "Describe the word" task shows the largest performance difference between the two models, with OOCR achieving a near-perfect score.
* The error bars indicate that the scores for some tasks have higher variability than others.
### Interpretation
The chart demonstrates that the OOCR model is generally more effective than the Baseline model in performing OCR tasks. The substantial difference in performance on the "Describe the word" task suggests that OOCR may be better at understanding the semantic content of the text. The poor performance of both models on certain tasks (e.g., "Multiple-choice codeword", "Function Codeword?") indicates that these tasks may be particularly challenging for OCR systems, potentially due to the complexity of the task or the nature of the input data. The error bars provide a measure of the uncertainty associated with the mean scores, highlighting the variability in performance across different instances of each task. The chart suggests that further research is needed to improve the performance of OCR models on challenging tasks and to reduce the variability in their performance.