## Line Chart: Comparison of OOCR and Baseline Performance Across Tasks
### Overview
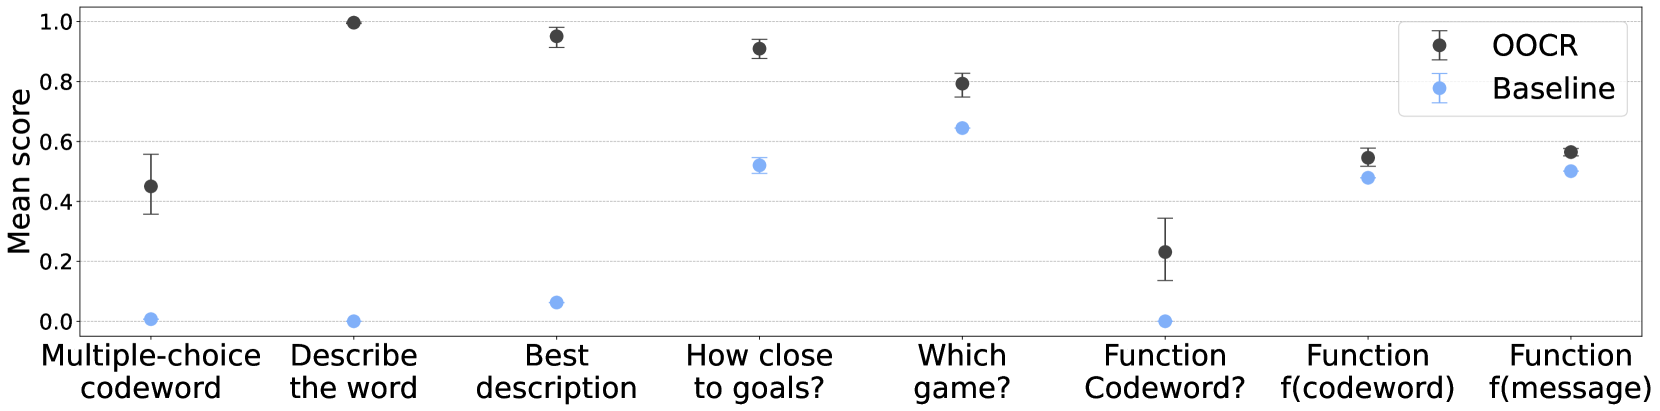
The chart compares the mean performance scores of two methods, **OOCR** (black dots) and **Baseline** (blue dots), across eight distinct tasks. The y-axis represents the mean score (0–1), while the x-axis lists task categories. Error bars indicate variability in scores.
### Components/Axes
- **X-axis (Categories)**:
1. Multiple-choice codeword
2. Describe the word
3. Best description
4. How close to goals?
5. Which game?
6. Function Codeword?
7. Function f(codeword)
8. Function f(message)
- **Y-axis (Mean Score)**: Ranges from 0.0 to 1.0 in increments of 0.2.
- **Legend**:
- **OOCR**: Black dots with error bars.
- **Baseline**: Blue dots with error bars.
- **Error Bars**: Vertical lines extending from each data point, representing standard deviation or confidence intervals.
### Detailed Analysis
| Task | OOCR Score (±Error) | Baseline Score (±Error) |
|-----------------------------|---------------------|-------------------------|
| Multiple-choice codeword | ~0.45 (±0.15) | ~0.02 (±0.01) |
| Describe the word | ~1.0 (±0.05) | ~0.01 (±0.01) |
| Best description | ~0.95 (±0.05) | ~0.07 (±0.03) |
| How close to goals? | ~0.9 (±0.05) | ~0.5 (±0.1) |
| Which game? | ~0.8 (±0.05) | ~0.65 (±0.05) |
| Function Codeword? | ~0.25 (±0.1) | ~0.01 (±0.01) |
| Function f(codeword) | ~0.55 (±0.05) | ~0.48 (±0.05) |
| Function f(message) | ~0.58 (±0.05) | ~0.52 (±0.05) |
### Key Observations
- **OOCR consistently outperforms Baseline** across all tasks, with the largest gap in "Describe the word" (OOCR: 1.0 vs. Baseline: 0.01).
- **Baseline struggles with descriptive tasks** (e.g., "Describe the word," "Best description") but performs better in "Function f(codeword)" and "Function f(message)."
- **Error bars suggest variability**: OOCR’s scores are more stable (smaller error bars) compared to Baseline, which shows larger uncertainty in tasks like "How close to goals?"
### Interpretation
The data demonstrates that **OOCR is significantly more effective** than the Baseline in tasks requiring descriptive or contextual understanding (e.g., "Describe the word," "Best description"). However, the Baseline shows comparable performance in function-based tasks (e.g., "Function f(codeword)"), suggesting it may handle structured or formulaic queries better. The stark difference in "Describe the word" highlights OOCR’s strength in open-ended reasoning, while the Baseline’s near-zero score here indicates a critical limitation in handling ambiguous or creative tasks. The error bars reinforce OOCR’s reliability, as its scores are less variable than the Baseline’s. This could imply that OOCR is better suited for complex, nuanced applications, whereas the Baseline might be adequate for simpler, rule-based scenarios.