## Scatter Plot: Compression-Spectral Shape Dissociation
### Overview
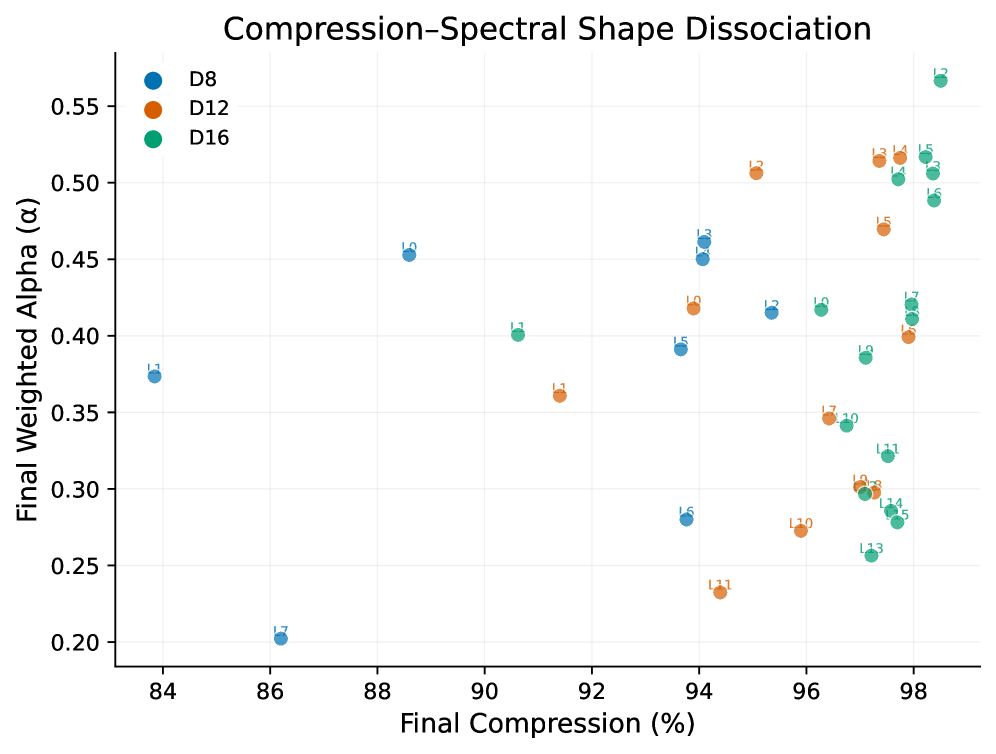
The image is a scatter plot visualizing the relationship between "Final Compression (%)" (x-axis) and "Final Weighted Alpha (α)" (y-axis). Three datasets (D8, D12, D16) are represented by distinct colors (blue, orange, green) with labeled data points (L1–L17). The plot emphasizes how compression levels correlate with spectral shape dissociation metrics.
---
### Components/Axes
- **X-axis**: "Final Compression (%)"
- Range: 84% to 98%
- Increments: 2% (84, 86, 88, ..., 98)
- **Y-axis**: "Final Weighted Alpha (α)"
- Range: 0.20 to 0.55
- Increments: 0.05 (0.20, 0.25, ..., 0.55)
- **Legend**:
- Top-left corner, labeled:
- D8 (blue)
- D12 (orange)
- D16 (green)
- **Data Points**:
- Labeled with "L" + numeric identifier (e.g., L1, L2, ..., L17)
- Colors match legend (blue = D8, orange = D12, green = D16).
---
### Detailed Analysis
#### Data Series Trends
1. **D8 (Blue)**:
- **Spatial Range**: 84%–94% compression.
- **Alpha Values**: 0.37–0.45 (L1: 0.37, L10: 0.45, L13: 0.45, L15: 0.28, L16: 0.27, L17: 0.20).
- **Trend**: Alpha decreases slightly with increasing compression (e.g., L1 at 84%: 0.37 → L17 at 94%: 0.20).
2. **D12 (Orange)**:
- **Spatial Range**: 92%–98% compression.
- **Alpha Values**: 0.23–0.50 (L10: 0.23, L11: 0.23, L13: 0.25, L14: 0.30, L15: 0.35, L16: 0.40, L17: 0.50).
- **Trend**: Alpha increases with compression (e.g., L10 at 92%: 0.23 → L17 at 98%: 0.50).
3. **D16 (Green)**:
- **Spatial Range**: 91%–98% compression.
- **Alpha Values**: 0.23–0.57 (L11: 0.23, L12: 0.40, L13: 0.25, L14: 0.30, L15: 0.35, L16: 0.40, L17: 0.57).
- **Trend**: Strong positive correlation between compression and alpha (e.g., L11 at 91%: 0.23 → L17 at 98%: 0.57).
#### Key Observations
- **Highest Alpha**: L17 (D16) at 98% compression (α = 0.57).
- **Lowest Alpha**: L17 (D8) at 94% compression (α = 0.20).
- **Outliers**:
- L17 (D8) deviates significantly from the D8 trend (low alpha despite high compression).
- L12 (D16) at 94% compression (α = 0.40) aligns with D16’s upward trend but is lower than L17.
---
### Interpretation
The data suggests a **general positive correlation** between compression and spectral shape dissociation (α), with **D16** exhibiting the strongest trend. D8 shows a weaker, more variable relationship, while D12 demonstrates a moderate increase. The outlier L17 (D8) at 94% compression (α = 0.20) may indicate an anomaly or a unique condition affecting dissociation. The plot highlights dataset-specific responses to compression, emphasizing the need for further investigation into factors influencing α variability.