## Diagram: LLM Benchmarks
### Overview
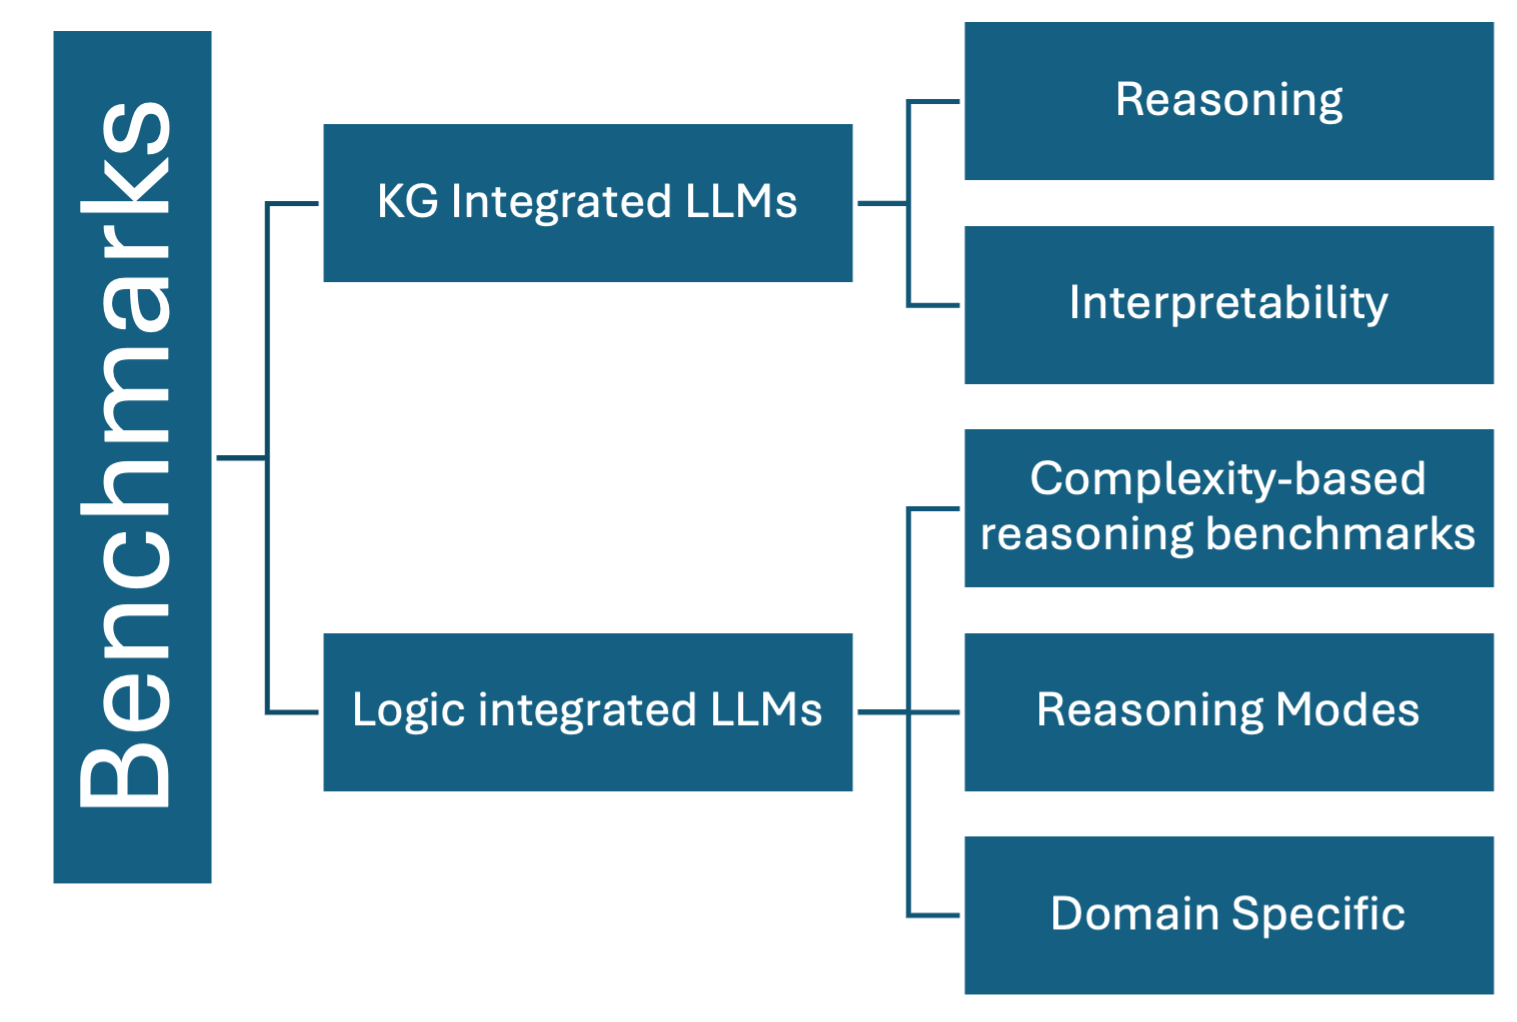
The image is a diagram outlining different categories and subcategories of benchmarks for Large Language Models (LLMs). The diagram uses a hierarchical structure, starting with "Benchmarks" as the main category, which then branches out into two main categories: "KG Integrated LLMs" and "Logic integrated LLMs". Each of these categories further branches out into subcategories. All text is in English.
### Components/Axes
* **Main Category:** "Benchmarks" (vertical blue rectangle on the left)
* **First-Level Categories:**
* "KG Integrated LLMs" (blue rectangle)
* "Logic integrated LLMs" (blue rectangle)
* **Second-Level Categories (Subcategories of KG Integrated LLMs):**
* "Reasoning" (blue rectangle)
* "Interpretability" (blue rectangle)
* **Second-Level Categories (Subcategories of Logic integrated LLMs):**
* "Complexity-based reasoning benchmarks" (blue rectangle)
* "Reasoning Modes" (blue rectangle)
* "Domain Specific" (blue rectangle)
### Detailed Analysis or ### Content Details
The diagram shows a tree-like structure. The "Benchmarks" category is connected to "KG Integrated LLMs" and "Logic integrated LLMs" via horizontal lines. "KG Integrated LLMs" is further connected to "Reasoning" and "Interpretability" via horizontal lines. "Logic integrated LLMs" is connected to "Complexity-based reasoning benchmarks", "Reasoning Modes", and "Domain Specific" via horizontal lines. All rectangles are the same color (blue) and have white text.
### Key Observations
* The diagram categorizes LLM benchmarks based on integration type (KG or Logic) and then further categorizes them based on specific aspects like reasoning, interpretability, complexity, reasoning modes, and domain specificity.
* The diagram is structured to show a clear hierarchy of benchmark categories.
### Interpretation
The diagram provides a high-level overview of different types of benchmarks used to evaluate Large Language Models (LLMs). It highlights the importance of considering both knowledge graph (KG) integration and logic integration when assessing LLMs. The subcategories further emphasize the diverse aspects of LLM performance that need to be evaluated, including reasoning abilities, interpretability, complexity handling, different reasoning modes, and domain-specific knowledge. The diagram suggests that a comprehensive evaluation of LLMs should consider all these factors.