## Line Chart: GoA vs. Number of Plane Waves
### Overview
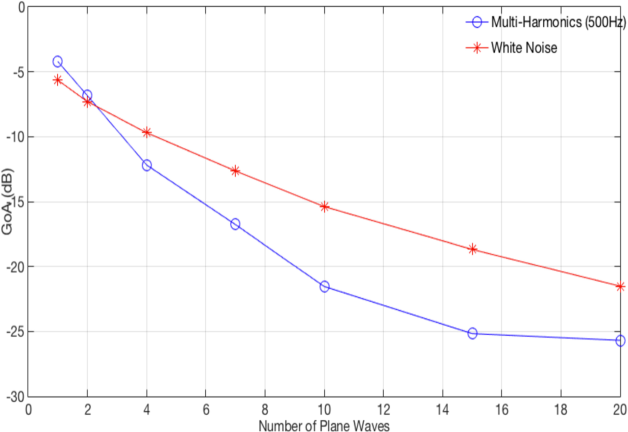
The image is a line chart comparing the GoA (Gain over Average) in decibels (dB) for Multi-Harmonics (500Hz) and White Noise as the number of plane waves increases. The x-axis represents the number of plane waves, ranging from 0 to 20. The y-axis represents the GoA in dB, ranging from -30 to 0.
### Components/Axes
* **Title:** There is no explicit title on the chart.
* **X-axis:**
* Label: "Number of Plane Waves"
* Scale: 0 to 20, with tick marks at every 2 units (0, 2, 4, 6, 8, 10, 12, 14, 16, 18, 20).
* **Y-axis:**
* Label: "GoA (dB)"
* Scale: -30 to 0, with tick marks at every 5 units (-30, -25, -20, -15, -10, -5, 0).
* **Legend:** Located in the top-right corner.
* Blue line with circle markers: "Multi-Harmonics (500Hz)"
* Red line with star markers: "White Noise"
### Detailed Analysis
* **Multi-Harmonics (500Hz) - Blue Line:**
* Trend: The GoA decreases as the number of plane waves increases. The decrease is steeper initially and then becomes more gradual.
* Data Points:
* 1 Plane Wave: Approximately -4 dB
* 2 Plane Waves: Approximately -7 dB
* 4 Plane Waves: Approximately -12 dB
* 8 Plane Waves: Approximately -17 dB
* 16 Plane Waves: Approximately -25 dB
* 20 Plane Waves: Approximately -26 dB
* **White Noise - Red Line:**
* Trend: The GoA decreases as the number of plane waves increases, but the decrease is less steep compared to Multi-Harmonics.
* Data Points:
* 1 Plane Wave: Approximately -6 dB
* 2 Plane Waves: Approximately -7 dB
* 4 Plane Waves: Approximately -10 dB
* 8 Plane Waves: Approximately -14 dB
* 16 Plane Waves: Approximately -19 dB
* 20 Plane Waves: Approximately -22 dB
### Key Observations
* Both Multi-Harmonics and White Noise show a decrease in GoA as the number of plane waves increases.
* The Multi-Harmonics signal experiences a more significant drop in GoA compared to White Noise, especially in the initial range of plane waves (1-8).
* As the number of plane waves increases beyond 16, the rate of decrease in GoA for both signals appears to slow down.
### Interpretation
The chart illustrates how the Gain over Average (GoA) changes for Multi-Harmonics (500Hz) and White Noise as the number of plane waves used in the simulation or measurement increases. The decreasing GoA suggests that as more plane waves are considered, the overall gain relative to the average decreases, potentially indicating a more diffuse or less focused signal.
The steeper decline in GoA for Multi-Harmonics compared to White Noise suggests that the Multi-Harmonics signal is more sensitive to the number of plane waves. This could be due to the specific frequency content and structure of the Multi-Harmonics signal, which might be more affected by interference or phase cancellation as more plane waves are introduced.
The data implies that using a smaller number of plane waves might be preferable for maintaining a higher GoA, especially for Multi-Harmonics signals. However, the choice of the optimal number of plane waves would depend on the specific application and the desired trade-off between GoA and other factors like spatial resolution or computational cost.