## Bar Charts: Performance Comparison of Manual Effort vs. APTPU-Gen
### Overview
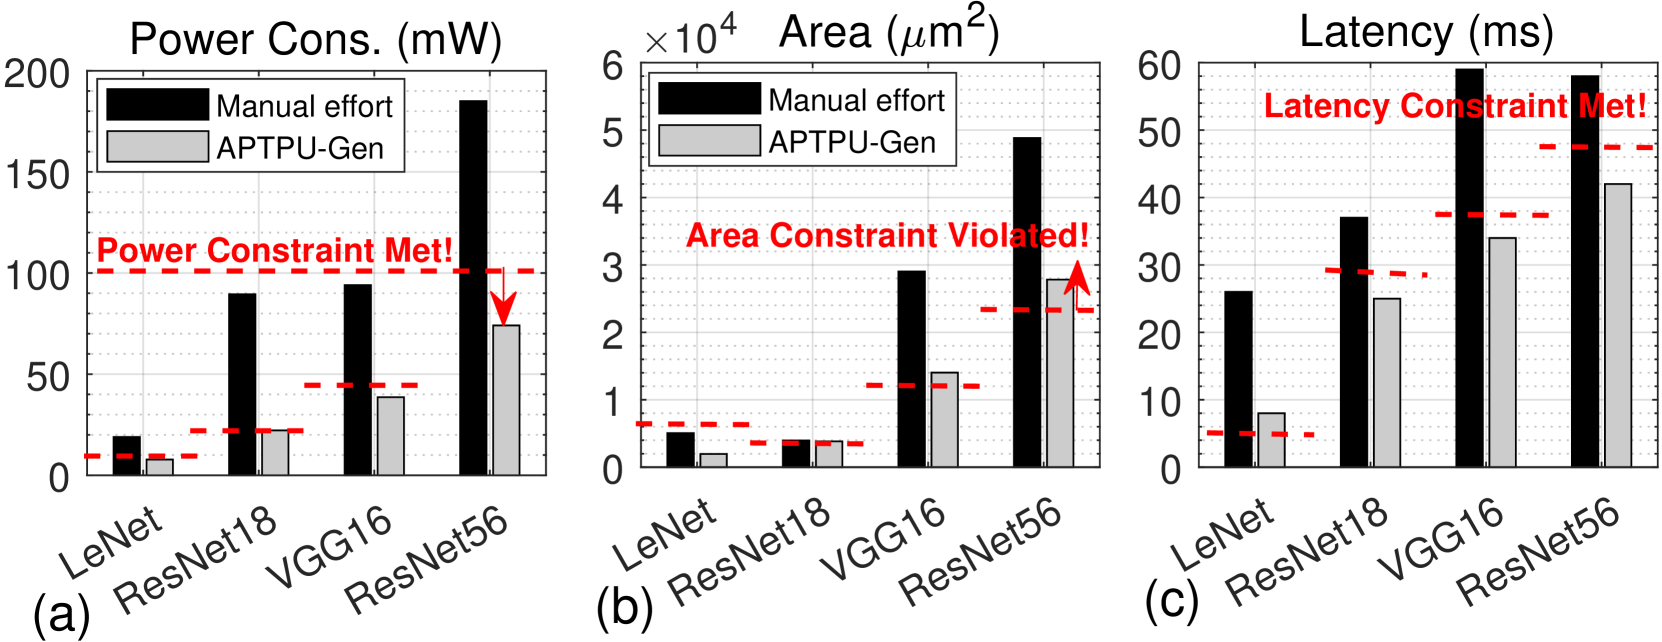
This image presents three bar charts (labeled (a), (b), and (c)) comparing the performance of "Manual effort" and "APTPU-Gen" across three metrics: Power Consumption (mW), Area (µm²), and Latency (ms). Each chart compares these methods for four different neural network architectures: LeNet, ResNet18, VGG16, and ResNet56. Horizontal dashed red lines indicate constraints for each metric, and text annotations indicate whether these constraints are met or violated.
### Components/Axes
Each chart shares the following components:
* **X-axis:** Neural Network Architecture (LeNet, ResNet18, VGG16, ResNet56)
* **Y-axis:**
* (a) Power Consumption (mW) - Scale from 0 to 200.
* (b) Area (µm²) - Scale from 0 to 6 x 10⁴.
* (c) Latency (ms) - Scale from 0 to 60.
* **Legend:**
* Black bars: "Manual effort"
* Gray bars: "APTPU-Gen"
* **Constraints:** Horizontal dashed red lines with annotations:
* (a) "Power Constraint Met!"
* (b) "Area Constraint Violated!"
* (c) "Latency Constraint Met!"
### Detailed Analysis or Content Details
**Chart (a): Power Consumption (mW)**
* **LeNet:** Manual effort ≈ 10 mW, APTPU-Gen ≈ 8 mW.
* **ResNet18:** Manual effort ≈ 20 mW, APTPU-Gen ≈ 15 mW.
* **VGG16:** Manual effort ≈ 110 mW, APTPU-Gen ≈ 80 mW.
* **ResNet56:** Manual effort ≈ 160 mW, APTPU-Gen ≈ 100 mW.
* The red dashed line is at approximately 100 mW. The "Power Constraint Met!" annotation is associated with the APTPU-Gen results.
**Chart (b): Area (µm²)**
* **LeNet:** Manual effort ≈ 0.2 x 10⁴ µm², APTPU-Gen ≈ 0.1 x 10⁴ µm².
* **ResNet18:** Manual effort ≈ 0.8 x 10⁴ µm², APTPU-Gen ≈ 0.5 x 10⁴ µm².
* **VGG16:** Manual effort ≈ 2.5 x 10⁴ µm², APTPU-Gen ≈ 2.0 x 10⁴ µm².
* **ResNet56:** Manual effort ≈ 3.5 x 10⁴ µm², APTPU-Gen ≈ 2.8 x 10⁴ µm².
* The red dashed line is at approximately 3 x 10⁴ µm². The "Area Constraint Violated!" annotation is associated with the Manual effort results.
**Chart (c): Latency (ms)**
* **LeNet:** Manual effort ≈ 5 ms, APTPU-Gen ≈ 3 ms.
* **ResNet18:** Manual effort ≈ 15 ms, APTPU-Gen ≈ 10 ms.
* **VGG16:** Manual effort ≈ 35 ms, APTPU-Gen ≈ 30 ms.
* **ResNet56:** Manual effort ≈ 50 ms, APTPU-Gen ≈ 40 ms.
* The red dashed line is at approximately 50 ms. The "Latency Constraint Met!" annotation is associated with the APTPU-Gen results.
### Key Observations
* APTPU-Gen consistently outperforms Manual effort across all three metrics and all four neural network architectures.
* The performance gap between the two methods widens as the complexity of the neural network increases (from LeNet to ResNet56).
* Manual effort violates the area constraint, while APTPU-Gen meets it.
* APTPU-Gen meets both the power and latency constraints, while manual effort does not consistently meet the power constraint.
### Interpretation
The data strongly suggests that APTPU-Gen is a superior method for optimizing neural network performance compared to Manual effort. It achieves lower power consumption, smaller area, and reduced latency across a range of network architectures. The increasing performance gap with network complexity indicates that APTPU-Gen is particularly effective for more demanding models. The constraint violations highlight the practical benefits of APTPU-Gen, as it enables designs that adhere to critical performance limitations. The consistent trend across all architectures suggests that the advantages of APTPU-Gen are not specific to any particular network structure. This data could be used to justify the adoption of APTPU-Gen as a preferred optimization technique in resource-constrained environments.