## Bar Charts: Comparison of Manual Effort vs. APTPU-Gen Across Neural Network Models
### Overview
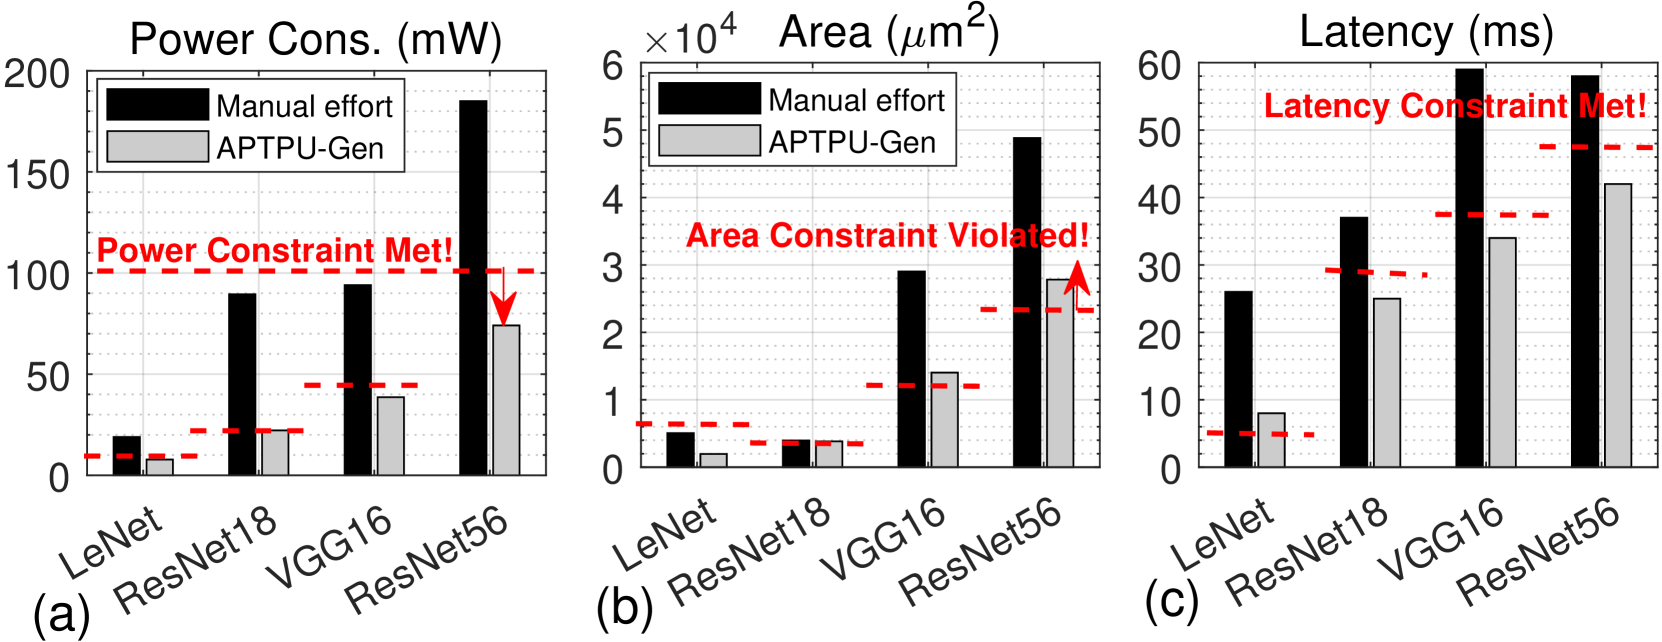
The image contains three side-by-side bar charts labeled (a), (b), and (c). Each chart compares two methods—"Manual effort" (black bars) and "APTPU-Gen" (gray bars)—across four neural network models: LeNet, ResNet18, VGG16, and ResNet56. The charts evaluate three distinct hardware design metrics: Power Consumption, Area, and Latency. Each chart includes a red dashed horizontal line representing a design constraint, with an annotation stating whether the constraint is met or violated.
### Components/Axes
**Common Elements Across All Charts:**
* **X-axis (Categories):** Four neural network models: `LeNet`, `ResNet18`, `VGG16`, `ResNet56`.
* **Legend:** Located in the top-left corner of each chart. A black square denotes `Manual effort`. A gray square denotes `APTPU-Gen`.
* **Constraint Line:** A red dashed horizontal line. Its vertical position (Y-value) varies per chart.
* **Annotation:** Red text placed near the constraint line.
**Chart (a): Power Consumption**
* **Title:** `Power Cons. (mW)`
* **Y-axis:** Linear scale from 0 to 200, with major ticks at 0, 50, 100, 150, 200. Label: `Power Cons. (mW)`.
* **Constraint Line Position:** At Y ≈ 100 mW.
* **Annotation Text:** `Power Constraint Met!` (positioned above the constraint line, spanning from ResNet18 to VGG16).
**Chart (b): Area**
* **Title:** `Area (µm²)`
* **Y-axis:** Linear scale from 0 to 6, with a multiplier `×10⁴` at the top. Major ticks at 0, 1, 2, 3, 4, 5, 6. Label: `Area (µm²)`.
* **Constraint Line Position:** At Y ≈ 2.4 (i.e., 24,000 µm²).
* **Annotation Text:** `Area Constraint Violated!` (positioned above the constraint line, spanning from VGG16 to ResNet56).
**Chart (c): Latency**
* **Title:** `Latency (ms)`
* **Y-axis:** Linear scale from 0 to 60, with major ticks at 0, 10, 20, 30, 40, 50, 60. Label: `Latency (ms)`.
* **Constraint Line Position:** At Y ≈ 48 ms.
* **Annotation Text:** `Latency Constraint Met!` (positioned above the constraint line, spanning from VGG16 to ResNet56).
### Detailed Analysis
**Chart (a) - Power Consumption (mW):**
* **Trend Verification:** For both methods, power consumption generally increases with model complexity (from LeNet to ResNet56). The `Manual effort` (black) bars show a steep, consistent increase. The `APTPU-Gen` (gray) bars also increase but at a much lower rate.
* **Data Points (Approximate):**
* **LeNet:** Manual ≈ 20 mW, APTPU-Gen ≈ 8 mW.
* **ResNet18:** Manual ≈ 90 mW, APTPU-Gen ≈ 22 mW.
* **VGG16:** Manual ≈ 95 mW, APTPU-Gen ≈ 40 mW.
* **ResNet56:** Manual ≈ 190 mW, APTPU-Gen ≈ 75 mW.
* **Constraint Check:** The red dashed line is at ~100 mW. All `APTPU-Gen` bars are below this line. The `Manual effort` bars for VGG16 and ResNet56 are above it. The annotation "Power Constraint Met!" likely refers to the APTPU-Gen results.
**Chart (b) - Area (µm²):**
* **Trend Verification:** Area usage increases with model complexity for both methods. The `Manual effort` bars show a very sharp increase, especially for VGG16 and ResNet56. The `APTPU-Gen` bars increase more moderately.
* **Data Points (Approximate, in units of 10⁴ µm²):**
* **LeNet:** Manual ≈ 0.6, APTPU-Gen ≈ 0.2.
* **ResNet18:** Manual ≈ 0.4, APTPU-Gen ≈ 0.4.
* **VGG16:** Manual ≈ 3.0, APTPU-Gen ≈ 1.4.
* **ResNet56:** Manual ≈ 5.0, APTPU-Gen ≈ 2.9.
* **Constraint Check:** The red dashed line is at ~2.4 (24,000 µm²). The `APTPU-Gen` bar for ResNet56 (≈2.9) is above this line. The annotation "Area Constraint Violated!" points directly to this violation with a red arrow.
**Chart (c) - Latency (ms):**
* **Trend Verification:** Latency increases with model complexity for both methods. The `Manual effort` bars are consistently higher than the `APTPU-Gen` bars for each corresponding model.
* **Data Points (Approximate):**
* **LeNet:** Manual ≈ 26 ms, APTPU-Gen ≈ 8 ms.
* **ResNet18:** Manual ≈ 37 ms, APTPU-Gen ≈ 25 ms.
* **VGG16:** Manual ≈ 60 ms, APTPU-Gen ≈ 34 ms.
* **ResNet56:** Manual ≈ 58 ms, APTPU-Gen ≈ 42 ms.
* **Constraint Check:** The red dashed line is at ~48 ms. All `APTPU-Gen` bars are below this line. The `Manual effort` bars for VGG16 and ResNet56 are above it. The annotation "Latency Constraint Met!" likely refers to the APTPU-Gen results.
### Key Observations
1. **Consistent Performance Advantage:** The `APTPU-Gen` method consistently outperforms `Manual effort` across all three metrics (Power, Area, Latency) for every neural network model shown.
2. **Scalability:** The performance gap between `Manual effort` and `APTPU-Gen` widens significantly for larger, more complex models (VGG16, ResNet56), particularly in Power Consumption and Area.
3. **Constraint Adherence:** `APTPU-Gen` successfully meets the power and latency constraints for all models. However, it violates the area constraint for the largest model, ResNet56.
4. **Area as a Bottleneck:** The "Area Constraint Violated!" annotation highlights that while `APTPU-Gen` improves efficiency, physical chip area remains a critical limiting factor for the most complex networks.
### Interpretation
This set of charts presents a compelling case for an automated hardware generation tool (`APTPU-Gen`) compared to traditional manual design efforts. The data suggests that `APTPU-Gen` is highly effective at optimizing for power consumption and computational latency, delivering substantial savings that scale well with model complexity. This is crucial for deploying neural networks on power-constrained edge devices.
However, the violation of the area constraint for ResNet56 reveals a key trade-off. The tool's optimizations may lead to less area-efficient circuit layouts for very large models, or the inherent complexity of ResNet56 simply demands more physical space than the constraint allows. This indicates that while `APTPU-Gen` is a powerful tool for performance optimization, area constraints must be carefully considered during the design phase, especially for large-scale models. The charts collectively argue that automated generation can surpass manual design in key performance metrics but requires careful constraint management to avoid physical implementation failures.