## Three-Panel Bar Chart: Performance Comparison of Neural Network Models
### Overview
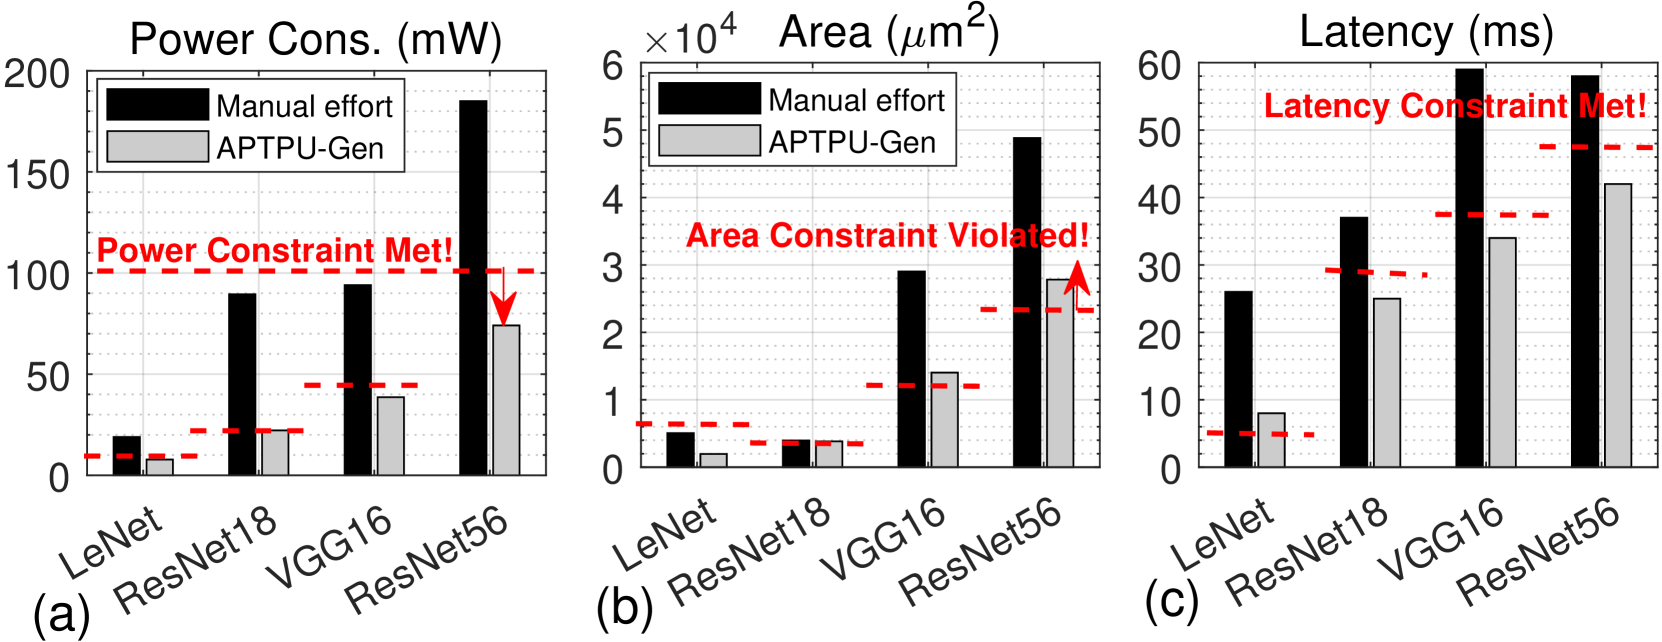
The image presents a comparative analysis of four neural network architectures (LeNet, ResNet18, VGG16, ResNet56) across three performance metrics: power consumption, computational area, and latency. Each metric is visualized in a separate panel with dual-bar comparisons between "Manual effort" (black bars) and "APTPU-Gen" (gray bars). Red dashed lines indicate constraint thresholds, with annotations highlighting compliance or violations.
---
### Components/Axes
1. **Panel (a): Power Consumption (mW)**
- **X-axis**: Neural network models (LeNet, ResNet18, VGG16, ResNet56)
- **Y-axis**: Power consumption in milliwatts (0–200 mW)
- **Legend**:
- Black = Manual effort
- Gray = APTPU-Gen
- **Annotations**:
- Red dashed line at 100 mW labeled "Power Constraint Met!"
- Red arrows pointing to ResNet56 (APTPU-Gen) and VGG16 (Manual effort)
2. **Panel (b): Area (μm² × 10⁴)**
- **X-axis**: Same neural network models
- **Y-axis**: Area in square micrometers (0–6×10⁴ μm²)
- **Legend**: Same as Panel (a)
- **Annotations**:
- Red dashed line at 3×10⁴ μm² labeled "Area Constraint Violated!"
- Red arrow pointing to ResNet56 (Manual effort)
3. **Panel (c): Latency (ms)**
- **X-axis**: Same neural network models
- **Y-axis**: Latency in milliseconds (0–60 ms)
- **Legend**: Same as Panel (a)
- **Annotations**:
- Red dashed line at 50 ms labeled "Latency Constraint Met!"
- Red arrows pointing to ResNet56 (Manual effort) and VGG16 (APTPU-Gen)
---
### Detailed Analysis
#### Panel (a): Power Consumption
- **LeNet**:
- Manual effort: ~15 mW
- APTPU-Gen: ~5 mW
- **ResNet18**:
- Manual effort: ~90 mW
- APTPU-Gen: ~30 mW
- **VGG16**:
- Manual effort: ~100 mW
- APTPU-Gen: ~50 mW
- **ResNet56**:
- Manual effort: ~180 mW
- APTPU-Gen: ~70 mW
- **Trend**: APTPU-Gen consistently reduces power consumption by 50–70% across all models.
#### Panel (b): Area
- **LeNet**:
- Manual effort: ~0.5×10⁴ μm²
- APTPU-Gen: ~0.2×10⁴ μm²
- **ResNet18**:
- Manual effort: ~0.3×10⁴ μm²
- APTPU-Gen: ~0.1×10⁴ μm²
- **VGG16**:
- Manual effort: ~3×10⁴ μm² (violates constraint)
- APTPU-Gen: ~1.5×10⁴ μm²
- **ResNet56**:
- Manual effort: ~5×10⁴ μm² (violates constraint)
- APTPU-Gen: ~2.5×10⁴ μm²
- **Trend**: APTPU-Gen reduces area by 50–70%, but ResNet56 and VGG16 still exceed the 3×10⁴ μm² threshold under manual effort.
#### Panel (c): Latency
- **LeNet**:
- Manual effort: ~25 ms
- APTPU-Gen: ~10 ms
- **ResNet18**:
- Manual effort: ~35 ms
- APTPU-Gen: ~20 ms
- **VGG16**:
- Manual effort: ~50 ms
- APTPU-Gen: ~30 ms
- **ResNet56**:
- Manual effort: ~55 ms
- APTPU-Gen: ~40 ms
- **Trend**: APTPU-Gen reduces latency by 40–55% across all models, with all APTPU-Gen values meeting the 50 ms constraint.
---
### Key Observations
1. **APTPU-Gen Advantages**:
- Achieves 50–70% reductions in power, area, and latency compared to manual effort.
- Meets power and latency constraints for all models.
- Reduces area violations for ResNet56 and VGG16 under manual effort.
2. **Outliers**:
- **ResNet56**: Highest values in all metrics (power: 180 mW, area: 5×10⁴ μm², latency: 55 ms).
- **VGG16**: Exceeds area constraint under manual effort (3×10⁴ μm²).
3. **Constraint Compliance**:
- Power and latency constraints are universally met by APTPU-Gen.
- Area constraint is violated for ResNet56 and VGG16 under manual effort but resolved with APTPU-Gen.
---
### Interpretation
The data demonstrates that APTPU-Gen significantly improves efficiency across all metrics compared to manual effort. While ResNet56 and VGG16 exceed area constraints in manual configurations, APTPU-Gen mitigates these violations, suggesting its potential for optimizing resource-constrained deployments. The consistent latency improvements (all APTPU-Gen values ≤40 ms) highlight its suitability for real-time applications. ResNet56’s high resource demands underscore the need for hardware-aware optimizations in large-scale models.