## Diagram: Process Flow and Transformations
### Overview
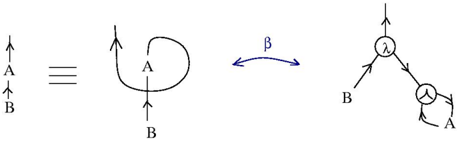
The image consists of three interconnected diagrams illustrating relationships between elements labeled **A**, **B**, **λ**, and **β**. Arrows indicate directional flows, loops, and branching pathways.
### Components/Axes
1. **Left Diagram**:
- Vertical arrow labeled **A** (top) and **B** (bottom).
- Equivalence symbol (**≡**) connects the arrow to a looped arrow.
2. **Middle Diagram**:
- Looped arrow with bidirectional **β** (beta) annotation.
- Arrows labeled **A** (top) and **B** (bottom) form a closed loop.
3. **Right Diagram**:
- Branching structure with nodes labeled **λ** (lambda) and **β** (beta).
- Arrows labeled **A** (left) and **B** (right) diverge from **λ** and converge at **β**.
### Detailed Analysis
- **Left Diagram**:
- Represents a direct relationship between **A** and **B** (vertical flow).
- Equivalence to the looped arrow suggests cyclical or iterative behavior.
- **Middle Diagram**:
- **β** (beta) governs the loop, indicating a feedback mechanism.
- **A** and **B** are interdependent within the loop.
- **Right Diagram**:
- **λ** (lambda) acts as a decision node splitting into **A** and **B**.
- **β** (beta) integrates outputs from **A** and **B**, suggesting a synthesis or resolution step.
### Key Observations
- **Cyclicality**: The looped arrow (middle diagram) emphasizes recurring processes governed by **β**.
- **Branching Logic**: The right diagram’s structure implies conditional pathways (e.g., **A** vs. **B**) resolved by **β**.
- **Equivalence**: The left diagram’s equivalence symbol (**≡**) links linear and cyclical representations of **A** and **B**.
### Interpretation
The diagrams collectively model a system where:
1. **A** and **B** are foundational states or variables.
2. **β** (beta) regulates transitions between states (loop) and integrates outcomes (branching).
3. **λ** (lambda) introduces decision points, while **β** ensures convergence.
This could represent computational logic (e.g., state machines), biological pathways, or decision-making frameworks. The absence of numerical data suggests a focus on structural relationships rather than quantitative metrics.