## Line Chart: ΔP vs. Layer for Llama Models
### Overview
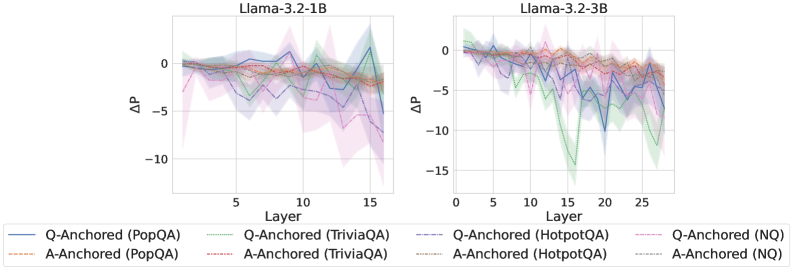
The image presents two line charts, side-by-side, displaying the change in performance (ΔP) across different layers of two Llama models: Llama-3.2-1B and Llama-3.2-3B. Each chart shows multiple lines representing different question-answering datasets and anchoring methods. The charts aim to visualize how performance changes as the model depth (layer) increases.
### Components/Axes
* **X-axis:** Layer (ranging from approximately 0 to 16 for the first chart and 0 to 25 for the second chart).
* **Y-axis:** ΔP (ranging from approximately -15 to 0).
* **Chart Titles:**
* Left Chart: "Llama-3.2-1B"
* Right Chart: "Llama-3.2-3B"
* **Legend:** Located at the bottom of the image, containing the following labels and corresponding line styles/colors:
* Q-Anchored (PopQA) - Solid Blue Line
* A-Anchored (PopQA) - Dashed Orange Line
* Q-Anchored (TriviaQA) - Solid Purple Line
* A-Anchored (TriviaQA) - Dashed Brown Line
* Q-Anchored (HotpotQA) - Dashed Pink Line
* A-Anchored (HotpotQA) - Dashed Green Line
* Q-Anchored (NQ) - Solid Teal Line
* A-Anchored (NQ) - Dashed Light Green Line
### Detailed Analysis or Content Details
**Llama-3.2-1B Chart (Left):**
* **Q-Anchored (PopQA):** Starts at approximately ΔP = 0, dips to around -2 at layer 3, fluctuates between -2 and 0, and ends around -1 at layer 16.
* **A-Anchored (PopQA):** Starts at approximately ΔP = 0, remains relatively stable around -1 to -2, and ends around -2 at layer 16.
* **Q-Anchored (TriviaQA):** Starts at approximately ΔP = 0, dips to around -3 at layer 3, rises to around -1 at layer 8, and ends around -5 at layer 16.
* **A-Anchored (TriviaQA):** Starts at approximately ΔP = 0, dips to around -2 at layer 3, remains relatively stable around -2 to -3, and ends around -4 at layer 16.
* **Q-Anchored (HotpotQA):** Starts at approximately ΔP = 0, dips to around -3 at layer 3, rises to around -1 at layer 8, and ends around -6 at layer 16.
* **A-Anchored (HotpotQA):** Starts at approximately ΔP = 0, dips to around -2 at layer 3, remains relatively stable around -2 to -3, and ends around -5 at layer 16.
* **Q-Anchored (NQ):** Starts at approximately ΔP = 0, dips to around -2 at layer 3, rises to around -1 at layer 8, and ends around -8 at layer 16.
* **A-Anchored (NQ):** Starts at approximately ΔP = 0, dips to around -1 at layer 3, remains relatively stable around -1 to -2, and ends around -6 at layer 16.
**Llama-3.2-3B Chart (Right):**
* **Q-Anchored (PopQA):** Starts at approximately ΔP = 0, dips to around -2 at layer 3, fluctuates between -2 and 0, and ends around -3 at layer 25.
* **A-Anchored (PopQA):** Starts at approximately ΔP = 0, remains relatively stable around -1 to -2, and ends around -3 at layer 25.
* **Q-Anchored (TriviaQA):** Starts at approximately ΔP = 0, dips to around -3 at layer 3, rises to around -1 at layer 8, and ends around -7 at layer 25.
* **A-Anchored (TriviaQA):** Starts at approximately ΔP = 0, dips to around -2 at layer 3, remains relatively stable around -2 to -3, and ends around -6 at layer 25.
* **Q-Anchored (HotpotQA):** Starts at approximately ΔP = 0, dips to around -3 at layer 3, rises to around -1 at layer 8, and ends around -8 at layer 25.
* **A-Anchored (HotpotQA):** Starts at approximately ΔP = 0, dips to around -2 at layer 3, remains relatively stable around -2 to -3, and ends around -7 at layer 25.
* **Q-Anchored (NQ):** Starts at approximately ΔP = 0, dips to around -2 at layer 3, rises to around -1 at layer 8, and ends around -10 at layer 25.
* **A-Anchored (NQ):** Starts at approximately ΔP = 0, dips to around -1 at layer 3, remains relatively stable around -1 to -2, and ends around -8 at layer 25.
### Key Observations
* In both charts, the ΔP generally decreases as the layer number increases, indicating a performance drop with model depth.
* The Q-Anchored lines tend to exhibit more significant fluctuations than the A-Anchored lines.
* The NQ dataset consistently shows the largest negative ΔP values, suggesting the most significant performance degradation with depth.
* The 3B model (right chart) generally exhibits a more pronounced performance drop (lower ΔP values) compared to the 1B model (left chart).
### Interpretation
The charts demonstrate that increasing model depth (layers) does not necessarily lead to improved performance, as indicated by the decreasing ΔP values. This suggests the presence of issues like vanishing gradients or overfitting as the model becomes deeper. The differences between Q-Anchored and A-Anchored lines might indicate that the method of anchoring questions or answers impacts the model's ability to maintain performance across layers. The consistently poor performance of the NQ dataset suggests that this dataset is particularly challenging for the models, and its performance degrades more rapidly with depth. The larger performance drop in the 3B model could be due to the increased complexity making it more susceptible to these issues. These findings highlight the importance of careful model design and training strategies to mitigate performance degradation in deep neural networks. The data suggests that simply adding more layers does not guarantee better results and that dataset selection and anchoring methods play a crucial role in maintaining performance.