## Line Charts: Llama-3.2 Model Layer-wise ΔP Analysis
### Overview
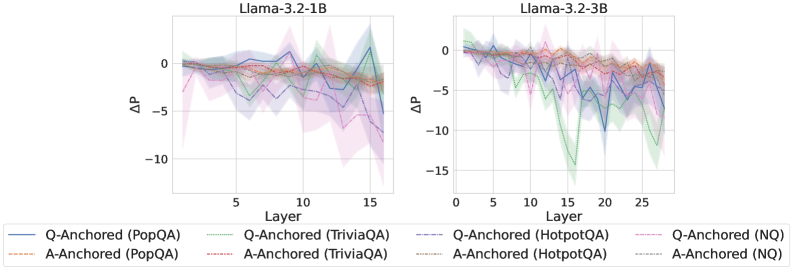
The image displays two side-by-side line charts comparing the performance metric "ΔP" across the layers of two different-sized language models: "Llama-3.2-1B" (left) and "Llama-3.2-3B" (right). Each chart plots multiple data series representing different experimental conditions (Q-Anchored vs. A-Anchored) applied to four distinct question-answering datasets (PopQA, TriviaQA, HotpotQA, NQ). The charts include shaded regions around each line, indicating variance or confidence intervals.
### Components/Axes
* **Chart Titles:**
* Left Chart: `Llama-3.2-1B`
* Right Chart: `Llama-3.2-3B`
* **X-Axis (Both Charts):**
* Label: `Layer`
* Scale: Linear, from 0 to approximately 16 (for 1B model) and 0 to approximately 28 (for 3B model). Major tick marks are at intervals of 5.
* **Y-Axis (Both Charts):**
* Label: `ΔP` (Delta P)
* Scale: Linear, negative values. The 1B chart ranges from approximately +2 to -12. The 3B chart ranges from approximately +2 to -16.
* **Legend (Bottom, spanning both charts):**
* **Q-Anchored Series (Solid Lines):**
* `Q-Anchored (PopQA)` - Solid blue line
* `Q-Anchored (TriviaQA)` - Solid green line
* `Q-Anchored (HotpotQA)` - Solid purple line
* `Q-Anchored (NQ)` - Solid red line
* **A-Anchored Series (Dashed Lines):**
* `A-Anchored (PopQA)` - Dashed orange line
* `A-Anchored (TriviaQA)` - Dashed brown line
* `A-Anchored (HotpotQA)` - Dashed gray line
* `A-Anchored (NQ)` - Dashed pink line
### Detailed Analysis
**Llama-3.2-1B Chart (Left):**
* **General Trend:** All series show a general downward trend in ΔP as the layer number increases, starting near 0 and becoming more negative. The decline is relatively gradual and noisy.
* **Q-Anchored Series (Solid Lines):**
* `Q-Anchored (TriviaQA)` (Green): Shows the most pronounced negative trend, reaching the lowest point of approximately -10 around layer 15.
* `Q-Anchored (HotpotQA)` (Purple): Also shows a strong negative trend, ending near -8.
* `Q-Anchored (PopQA)` (Blue) and `Q-Anchored (NQ)` (Red): Follow a similar, slightly less negative path, ending between -4 and -6.
* **A-Anchored Series (Dashed Lines):**
* These series generally exhibit less negative ΔP values compared to their Q-Anchored counterparts for the same dataset. They cluster more tightly together, ending in the range of -2 to -4.
* **Variance (Shaded Areas):** The shaded confidence intervals are substantial for all lines, often overlapping, indicating high variability in the measurements, especially in the middle layers (5-15).
**Llama-3.2-3B Chart (Right):**
* **General Trend:** Similar downward trend as the 1B model, but the magnitude of negative ΔP is significantly larger, and the curves are more volatile with sharper dips.
* **Q-Anchored Series (Solid Lines):**
* `Q-Anchored (TriviaQA)` (Green): Exhibits the most extreme behavior, with a dramatic drop to approximately -15 around layer 15, followed by a partial recovery.
* `Q-Anchored (HotpotQA)` (Purple): Shows a steep decline, reaching near -12 around layer 20.
* `Q-Anchored (PopQA)` (Blue) and `Q-Anchored (NQ)` (Red): Follow a steep downward path, ending between -8 and -10.
* **A-Anchored Series (Dashed Lines):**
* Again, these show a less severe decline than the Q-Anchored series. They end in the range of -4 to -7, with `A-Anchored (TriviaQA)` (Brown) being the most negative among them.
* **Variance (Shaded Areas):** Variance remains high, particularly for the Q-Anchored series during their steep descents.
### Key Observations
1. **Model Size Effect:** The larger 3B model exhibits both a greater magnitude of negative ΔP and more pronounced volatility across layers compared to the 1B model.
2. **Anchoring Method Effect:** Across both models and all datasets, the **Q-Anchored** method (solid lines) consistently results in more negative ΔP values than the **A-Anchored** method (dashed lines).
3. **Dataset Sensitivity:** The `TriviaQA` dataset (green/brown lines) appears most sensitive to the layer-wise effect, showing the largest negative ΔP, especially under Q-Anchoring. `HotpotQA` (purple/gray) is the next most sensitive.
4. **Layer-wise Degradation:** ΔP does not improve with depth; it degrades. The most significant negative changes often occur in the middle-to-late layers (e.g., layers 10-20 for the 3B model).
5. **High Variance:** The wide shaded regions suggest that the measured ΔP is not stable and has significant run-to-run or sample-to-sample variability.
### Interpretation
The charts demonstrate a systematic degradation in the measured metric (ΔP) as information propagates through the layers of Llama-3.2 models. The key finding is that the **choice of anchoring method (Q vs. A) has a larger and more consistent impact on this degradation than the specific dataset used**. Q-Anchoring leads to a more severe layer-wise decline in ΔP.
The increased volatility and magnitude of the effect in the 3B model suggest that larger models may be more susceptible to this form of signal degradation or that the effect is amplified with scale. The particularly strong effect on `TriviaQA` and `HotpotQA` might indicate that these datasets, which likely require more complex reasoning or multi-hop retrieval, are more vulnerable to the perturbations introduced by the anchoring process across layers.
**In essence, the data suggests that for the Llama-3.2 architecture, using an A-Anchored approach results in a more stable preservation of the ΔP metric across network depth compared to a Q-Anchored approach, and this finding holds across multiple evaluation datasets.** The high variance, however, implies that these trends, while clear on average, may not be uniform for every input.