## Line Graphs: Llama-3.2-1B and Llama-3.2-3B Performance Across Layers
### Overview
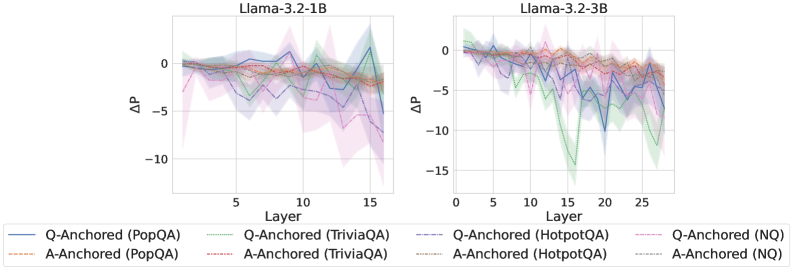
The image contains two line graphs comparing the performance of different Q-Anchored and A-Anchored models across layers for two versions of the Llama-3.2 architecture (1B and 3B parameters). Each graph shows ΔP (change in performance) on the y-axis and Layer on the x-axis. Multiple data series are represented with distinct line styles and colors, with shaded regions indicating confidence intervals.
### Components/Axes
- **X-axis (Layer)**:
- Llama-3.2-1B: Layers 0–15 (discrete intervals).
- Llama-3.2-3B: Layers 0–25 (discrete intervals).
- **Y-axis (ΔP)**:
- Range: -15 to 0 (for Llama-3.2-3B) and -10 to 0 (for Llama-3.2-1B).
- **Legend**:
- Positioned at the bottom of both graphs.
- Entries:
- **Q-Anchored (PopQA)**: Solid blue.
- **A-Anchored (PopQA)**: Dashed orange.
- **Q-Anchored (TriviaQA)**: Solid green.
- **A-Anchored (TriviaQA)**: Dashed red.
- **Q-Anchored (HotpotQA)**: Solid purple.
- **A-Anchored (HotpotQA)**: Dashed brown.
- **Q-Anchored (NQ)**: Solid pink.
- **A-Anchored (NQ)**: Dashed gray.
### Detailed Analysis
#### Llama-3.2-1B Graph
- **Q-Anchored (PopQA)**: Starts near 0, peaks at ~2 (Layer 5), then drops to ~-5 (Layer 15).
- **A-Anchored (PopQA)**: Starts near 0, fluctuates between -1 and 1, ending near -2.
- **Q-Anchored (TriviaQA)**: Starts near 0, dips to ~-3 (Layer 10), then rises to ~-1.
- **A-Anchored (TriviaQA)**: Starts near 0, fluctuates between -1 and 1, ending near -1.
- **Q-Anchored (HotpotQA)**: Starts near 0, peaks at ~3 (Layer 5), then drops to ~-4 (Layer 15).
- **A-Anchored (HotpotQA)**: Starts near 0, fluctuates between -1 and 1, ending near -1.
- **Q-Anchored (NQ)**: Starts near 0, dips to ~-2 (Layer 10), then rises to ~-1.
- **A-Anchored (NQ)**: Starts near 0, fluctuates between -1 and 1, ending near -1.
#### Llama-3.2-3B Graph
- **Q-Anchored (PopQA)**: Starts near 0, peaks at ~2 (Layer 5), then drops to ~-5 (Layer 25).
- **A-Anchored (PopQA)**: Starts near 0, fluctuates between -1 and 1, ending near -2.
- **Q-Anchored (TriviaQA)**: Starts near 0, dips to ~-4 (Layer 10), then rises to ~-1.
- **A-Anchored (TriviaQA)**: Starts near 0, fluctuates between -1 and 1, ending near -1.
- **Q-Anchored (HotpotQA)**: Starts near 0, peaks at ~3 (Layer 5), then drops to ~-6 (Layer 25).
- **A-Anchored (HotpotQA)**: Starts near 0, fluctuates between -1 and 1, ending near -1.
- **Q-Anchored (NQ)**: Starts near 0, dips to ~-3 (Layer 10), then rises to ~-1.
- **A-Anchored (NQ)**: Starts near 0, fluctuates between -1 and 1, ending near -1.
### Key Observations
1. **Model Size Impact**:
- Llama-3.2-3B shows more pronounced fluctuations in ΔP compared to Llama-3.2-1B, particularly in HotpotQA and TriviaQA.
- The 3B model’s ΔP values are generally lower (more negative) in later layers.
2. **Dataset-Specific Trends**:
- **HotpotQA**: Q-Anchored models exhibit the largest drops in ΔP for both 1B and 3B, with sharper declines in the 3B version.
- **NQ**: Q-Anchored models show moderate dips, while A-Anchored models remain relatively stable.
- **PopQA/TriviaQA**: A-Anchored models demonstrate smaller variations compared to Q-Anchored counterparts.
3. **Confidence Intervals**:
- Shaded regions (likely 95% confidence intervals) are widest in the 3B model’s HotpotQA and TriviaQA series, indicating higher uncertainty in later layers.
### Interpretation
The data suggests that Q-Anchored models (e.g., PopQA, TriviaQA, HotpotQA) experience greater performance degradation (ΔP) in deeper layers compared to A-Anchored models. This trend is more pronounced in the larger 3B model, particularly for complex datasets like HotpotQA. The stability of A-Anchored models across layers implies they may be more robust to architectural scaling. However, the widening confidence intervals in the 3B model highlight increased variability in performance, possibly due to the model’s complexity. The consistent dips in Q-Anchored models for HotpotQA suggest this dataset is more sensitive to layer-specific architectural changes.