## Diagram: Hierarchical Code Generation and Repair Process
### Overview
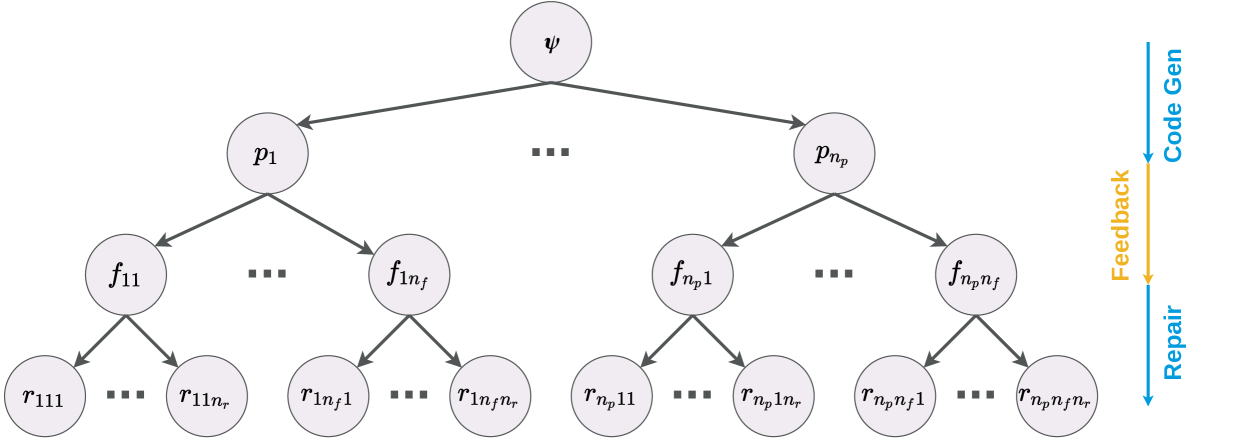
The image depicts a hierarchical diagram illustrating a code generation and repair process. It shows a tree-like structure with nodes representing different stages or components, connected by arrows indicating the flow of information. The diagram also includes a feedback loop for repair.
### Components/Axes
* **Nodes:** The diagram consists of circular nodes labeled with variables and indices.
* Top-level node: ψ (Psi)
* Second-level nodes: p1, ..., pnp
* Third-level nodes: f11, ..., f1nf, fnp1, ..., fnpnf
* Fourth-level nodes: r111, ..., r11nr, r1nf1, ..., r1nfnr, rnp11, ..., rnp1nr, rnpnf1, ..., rnpnfnr
* **Arrows:** Arrows connect the nodes, indicating the direction of flow.
* **Ellipses:** Horizontal ellipses (...) are used to indicate that there are intermediate nodes not explicitly shown.
* **Right-side labels:**
* "Code Gen" (blue arrow pointing downwards)
* "Feedback" (yellow arrow pointing downwards)
* "Repair" (blue arrow pointing downwards)
### Detailed Analysis
The diagram represents a hierarchical process, starting from the top node ψ. This node branches out to multiple nodes p1 to pnp. Each p node further branches out to f nodes, and each f node branches out to r nodes.
* **Top Level:** The process starts with a single node labeled ψ.
* **Second Level:** ψ branches into p1, ..., pnp. The number of p nodes is denoted by 'np'.
* **Third Level:** Each p node (e.g., p1) branches into f nodes (e.g., f11, ..., f1nf). The number of f nodes for p1 is 'nf'. Similarly, pnp branches into fnp1, ..., fnpnf.
* **Fourth Level:** Each f node (e.g., f11) branches into r nodes (e.g., r111, ..., r11nr). The number of r nodes for f11 is 'nr'. Similarly, f1nf branches into r1nf1, ..., r1nfnr, and so on.
* **Feedback Loop:** On the right side, "Code Gen" (blue) indicates the initial code generation step. "Feedback" (yellow) suggests a feedback mechanism, and "Repair" (blue) indicates a repair process based on the feedback. The arrows suggest a sequential flow: Code Generation -> Feedback -> Repair.
### Key Observations
* The diagram illustrates a multi-level hierarchical structure.
* The indices suggest a nested structure, where each level depends on the previous one.
* The "Code Gen," "Feedback," and "Repair" labels indicate an iterative process.
### Interpretation
The diagram likely represents a code generation and repair system where the initial code (ψ) is refined through multiple stages (p, f, r). The indices suggest that the number of branches at each level can vary. The feedback loop indicates that the generated code is evaluated, and repairs are made based on the feedback, leading to an iterative refinement process. The diagram provides a high-level overview of the system's architecture and workflow.