## Decision Tree Diagram
### Overview
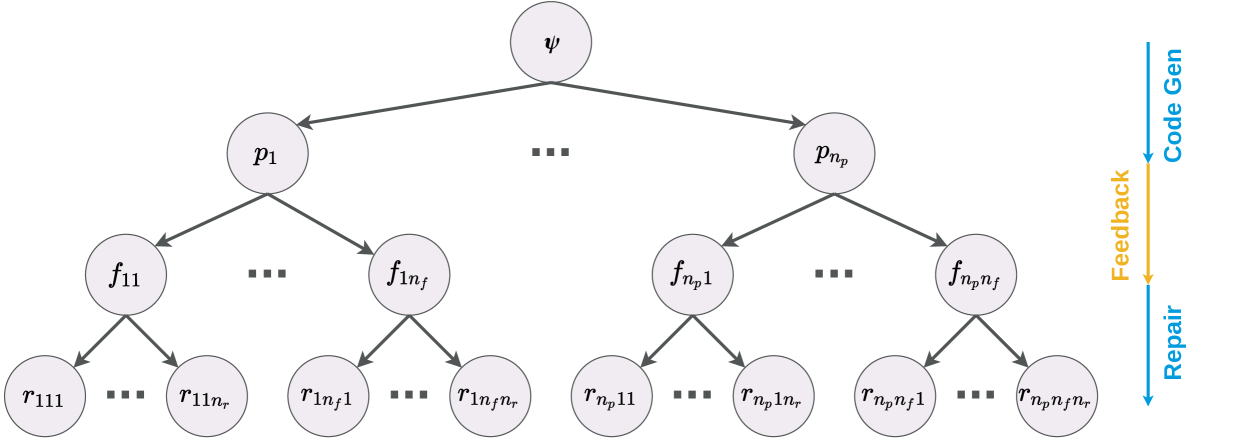
The image depicts a decision tree diagram, which is a flowchart-like tree structure used to represent a set of decisions and their possible consequences. The diagram is used to illustrate the process of making decisions based on certain criteria or conditions.
### Components/Axes
- **Root Node**: The topmost node labeled "ψ" represents the starting point of the decision tree.
- **Decision Nodes**: The nodes labeled "p1", "p2", ..., "pn_p" represent the different decision points in the process.
- **Branch Nodes**: The nodes labeled "f11", "f1n_f", ..., "fn_p fn_f" represent the different possible outcomes or paths that can be taken from each decision point.
- **Leaf Nodes**: The nodes labeled "r111", "r11n_r", ..., "rn_p fn_f" represent the final outcomes or results of the decision-making process.
### Detailed Analysis or ### Content Details
The decision tree diagram shows a hierarchical structure with multiple levels of decision points. Each decision point has multiple possible outcomes, represented by the branch nodes. The final outcomes are represented by the leaf nodes.
### Key Observations
- The diagram has a total of n decision points, represented by the nodes labeled "p1", "p2", ..., "pn_p".
- Each decision point has multiple possible outcomes, represented by the branch nodes.
- The final outcomes are represented by the leaf nodes.
- The diagram shows a clear flow from the root node to the leaf nodes, indicating the process of decision-making.
### Interpretation
The decision tree diagram illustrates the process of decision-making based on certain criteria or conditions. The diagram shows a hierarchical structure with multiple levels of decision points, each with multiple possible outcomes. The final outcomes are represented by the leaf nodes, indicating the end result of the decision-making process. The diagram can be used to analyze the decision-making process and identify the most likely outcomes based on the given criteria or conditions.