## Heatmap: Recurrence vs. Hops Across Different R Values
### Overview
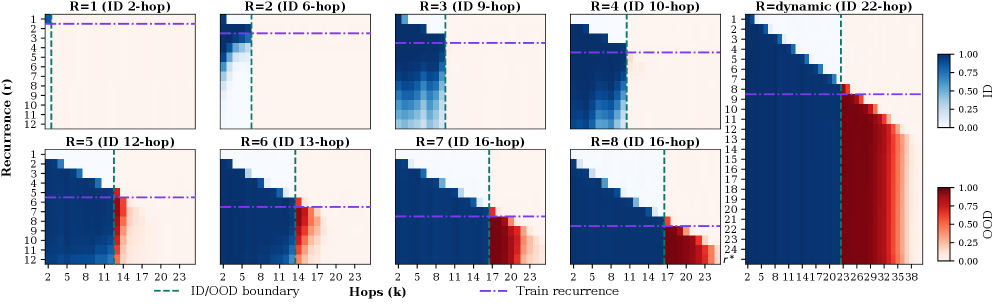
The image is a composite heatmap visualization comparing recurrence patterns across multiple panels, each representing different model configurations (R=1 to R=8 and dynamic R). The visualization tracks recurrence values (r) against hop counts (k) with color intensity indicating magnitude. Key elements include:
- Vertical dashed green lines marking ID/OOD boundaries
- Horizontal purple lines indicating train recurrence thresholds
- Color gradient from blue (low recurrence) to red (high recurrence)
### Components/Axes
**Axes:**
- **Y-axis (Recurrence, r):** Integer values 1-12 (logarithmic scale)
- **X-axis (Hops, k):** Integer values 2-23 (linear scale)
- **Legend:**
- Green dashed line: ID/OOD boundary
- Purple line: Train recurrence threshold
- Color scale: Blue (0.00) to Red (1.00)
**Panel Structure:**
- 9 panels arranged in 3x3 grid
- Panel titles specify R values and ID hop counts:
- Top row: R=1 (2-hop), R=2 (6-hop), R=3 (9-hop)
- Middle row: R=4 (10-hop), R=5 (12-hop), R=6 (13-hop)
- Bottom row: R=7 (16-hop), R=8 (16-hop), R=dynamic (22-hop)
### Detailed Analysis
**Color Distribution Patterns:**
1. **ID/OOD Boundary (Green Line):**
- Position shifts rightward as R increases
- R=1: k=11 | R=2: k=11 | R=3: k=11 | R=4: k=11
- R=5: k=14 | R=6: k=14 | R=7: k=17 | R=8: k=17
- Dynamic R: k=17
2. **Train Recurrence (Purple Line):**
- Consistently at r=8 across all panels
- Exception: R=1 panel shows no visible purple line
3. **Recurrence Intensity:**
- Blue dominance (low recurrence) in upper-right regions
- Red dominance (high recurrence) in lower-left regions
- Gradual transition from blue to red as R increases
**Notable Data Points:**
- R=1 panel: Entirely blue except for k=2-5 (partial red)
- R=8 panel: Strong red region at k=2-10, r=5-8
- Dynamic R panel: Most extensive red region (k=2-17, r=5-12)
### Key Observations
1. **Boundary Shift:** ID/OOD boundary moves rightward with increasing R (k=11→17)
2. **Recurrence Concentration:** Higher R values show stronger recurrence in lower hop ranges
3. **Train Recurrence Consistency:** Purple line remains at r=8 across all configurations
4. **Dynamic R Anomaly:** Largest hop range (2-358) with most pronounced red region
### Interpretation
The visualization demonstrates that:
1. **Model Complexity Impact:** Increasing R values correlate with rightward shifts in ID/OOD boundaries, suggesting greater model capacity to distinguish in-distribution data
2. **Recurrence Thresholding:** The consistent r=8 threshold across configurations may represent an optimal performance benchmark
3. **Hop-Recurrence Relationship:** Lower hop counts (k=2-10) consistently show higher recurrence values, indicating stronger pattern recognition in early stages
4. **Dynamic R Behavior:** The extended hop range (up to 358) with concentrated red region suggests specialized handling of longer sequences
The color gradient intensity and boundary positioning imply that model configuration (R value) significantly influences both data separation capabilities and recurrence pattern recognition. The dynamic R configuration appears optimized for handling extended sequence lengths while maintaining strong recurrence in early hops.