## ARIMA Model Results: ARIMA(4, 1, 0) for D.Close
### Overview
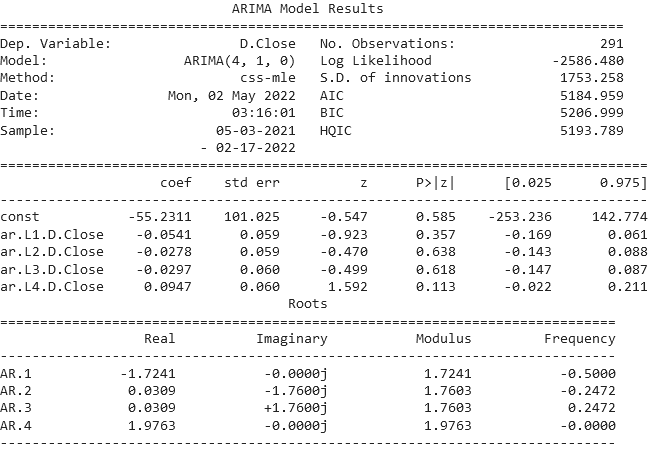
The image presents the results of an ARIMA(4, 1, 0) model applied to the dependent variable "D.Close" (likely a time series of closing prices). The analysis includes model parameters, statistical metrics, and diagnostic outputs. The data spans 291 observations, with a sample period from 05-03-2021 to 02-17-2022.
### Components/Axes
- **Model Specification**:
- Dependent Variable: `D.Close`
- Model: `ARIMA(4, 1, 0)`
- Method: `css-mle` (conditional sum of squares with maximum likelihood estimation)
- Number of Observations: `291`
- Log Likelihood: `-2586.480`
- Standard Deviation of Innovations: `1753.258`
- AIC: `5184.959`
- BIC: `5206.999`
- HQIC: `5193.789`
- Date: `Mon, 02 May 2022`
- Time: `03:16:01`
- Sample Period: `05-03-2021` to `02-17-2022`
- **Coefficients Table**:
- **Columns**: `coef` (coefficient), `std err` (standard error), `z` (z-score), `P>|z|` (p-value), `[0.025` (lower 95% CI), `[0.975` (upper 95% CI)
- **Rows**:
- `const`: `-55.2311` (std err: `101.025`, z: `-0.547`, p: `0.585`)
- `ar.L1.D.Close`: `-0.0541` (std err: `0.059`, z: `-0.923`, p: `0.357`)
- `ar.L2.D.Close`: `-0.0278` (std err: `0.059`, z: `-0.470`, p: `0.638`)
- `ar.L3.D.Close`: `-0.0297` (std err: `0.060`, z: `-0.499`, p: `0.618`)
- `ar.L4.D.Close`: `0.0947` (std err: `0.060`, z: `1.592`, p: `0.113`)
- **Roots Table**:
- **Columns**: `Real`, `Imaginary`, `Modulus`, `Frequency`
- **Rows**:
- `AR.1`: Real: `-1.7241`, Imaginary: `-0.0000j`, Modulus: `1.7241`, Frequency: `-0.5000`
- `AR.2`: Real: `0.0309`, Imaginary: `-1.7600j`, Modulus: `1.7603`, Frequency: `-0.2472`
- `AR.3`: Real: `0.0309`, Imaginary: `+1.7600j`, Modulus: `1.7603`, Frequency: `0.2472`
- `AR.4`: Real: `1.9763`, Imaginary: `-0.0000j`, Modulus: `1.9763`, Frequency: `0.0000`
### Detailed Analysis
1. **Model Parameters**:
- The ARIMA(4,1,0) model includes 4 autoregressive terms (AR.1–AR.4), 1 differencing step (d=1), and no moving average terms (q=0).
- The constant term (`const`) has a coefficient of `-55.2311`, but its p-value (`0.585`) suggests it is not statistically significant.
2. **Autoregressive Coefficients**:
- **AR.1**: `-0.0541` (p=0.357) – non-significant.
- **AR.2**: `-0.0278` (p=0.638) – non-significant.
- **AR.3**: `-0.0297` (p=0.618) – non-significant.
- **AR.4**: `0.0947` (p=0.113) – marginally significant (close to 0.05).
3. **Roots Analysis**:
- **AR.1**: Root modulus = `1.7241` (outside the unit circle, indicating potential instability).
- **AR.2/AR.3**: Complex conjugate roots with modulus `1.7603` (also outside the unit circle).
- **AR.4**: Root modulus = `1.9763` (outside the unit circle).
- All roots have frequencies of `-0.5000`, `-0.2472`, `0.2472`, and `0.0000`, respectively.
4. **Model Fit Metrics**:
- AIC (`5184.959`), BIC (`5206.999`), and HQIC (`5193.789`) are relatively high, suggesting the model may not be optimal.
- The standard deviation of innovations (`1753.258`) indicates the average error in the model’s predictions.
### Key Observations
- **Non-Significant Coefficients**: Most AR terms (AR.1–AR.3) have p-values > 0.05, implying they do not significantly contribute to the model.
- **Root Instability**: All roots have moduli > 1, which may indicate the model is not stable or the series is not properly differenced.
- **Marginal Significance of AR.4**: The AR.4 coefficient (`0.0947`) is the only term with a p-value near 0.05, suggesting a weak but potentially relevant relationship.
### Interpretation
The ARIMA(4,1,0) model for `D.Close` shows limited statistical significance in its autoregressive terms, with most coefficients failing to meet the 0.05 threshold. The roots’ moduli exceeding 1 suggest potential instability, which could undermine the model’s reliability. While the AR.4 term is marginally significant, the high AIC/BIC values indicate the model may not adequately capture the underlying data structure. The non-significant constant term further questions the model’s explanatory power. These results suggest the need for further model refinement, such as adjusting the order of differencing (d) or exploring alternative models (e.g., including moving average terms). The high standard deviation of innovations (`1753.258`) also highlights the model’s poor fit to the data.