## ARIMA Model Results
### Overview
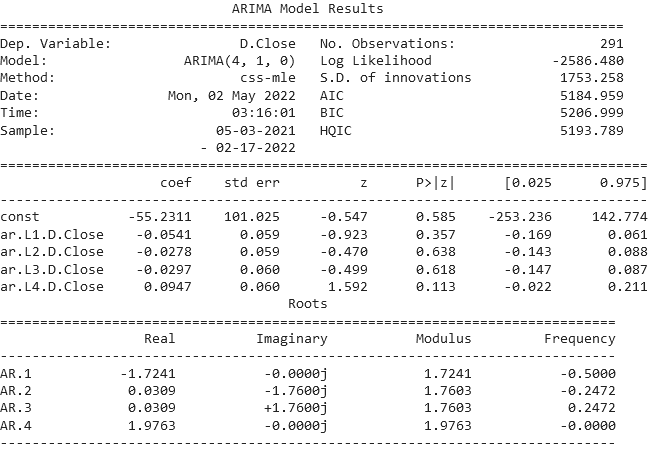
The image presents the results of an ARIMA (Autoregressive Integrated Moving Average) model. It includes model specifications, goodness-of-fit statistics, coefficient estimates, and root analysis.
### Components/Axes
**Header:**
* Title: ARIMA Model Results
* Dep. Variable: D.Close
* Model: ARIMA(4, 1, 0)
* Method: css-mle
* Date: Mon, 02 May 2022
* Time: 03:16:01
* Sample: 05-03-2021 - 02-17-2022
* No. Observations: 291
* Log Likelihood: -2586.480
* S.D. of innovations: 1753.258
* AIC: 5184.959
* BIC: 5206.999
* HQIC: 5193.789
**Coefficient Estimates Table:**
* Columns: coef, std err, z, P>|z|, [0.025, 0.975]
* Rows: const, ar.L1.D.Close, ar.L2.D.Close, ar.L3.D.Close, ar.L4.D.Close
**Roots Table:**
* Columns: Real, Imaginary, Modulus, Frequency
* Rows: AR.1, AR.2, AR.3, AR.4
### Detailed Analysis
**Coefficient Estimates Table:**
| | coef | std err | z | P>\|z\| | \[0.025 | 0.975] |
|---------------|-----------|---------|---------|---------|-----------|-----------|
| const | -55.2311 | 101.025 | -0.547 | 0.585 | -253.236 | 142.774 |
| ar.L1.D.Close | -0.0541 | 0.059 | -0.923 | 0.357 | -0.169 | 0.061 |
| ar.L2.D.Close | -0.0278 | 0.059 | -0.470 | 0.638 | -0.143 | 0.088 |
| ar.L3.D.Close | -0.0297 | 0.060 | -0.499 | 0.618 | -0.147 | 0.087 |
| ar.L4.D.Close | 0.0947 | 0.060 | 1.592 | 0.113 | -0.022 | 0.211 |
**Roots Table:**
| | Real | Imaginary | Modulus | Frequency |
|-------|-----------|-----------|---------|-----------|
| AR.1 | -1.7241 | -0.0000j | 1.7241 | -0.5000 |
| AR.2 | 0.0309 | -1.7600j | 1.7603 | -0.2472 |
| AR.3 | 0.0309 | +1.7600j | 1.7603 | 0.2472 |
| AR.4 | 1.9763 | -0.0000j | 1.9763 | -0.0000 |
### Key Observations
* The dependent variable is "D.Close".
* The ARIMA model is of order (4, 1, 0).
* The sample period is from 05-03-2021 to 02-17-2022.
* Most of the coefficients for the autoregressive terms (ar.L1.D.Close to ar.L4.D.Close) are not statistically significant at a 5% significance level (P>|z| > 0.05).
* The roots of the AR polynomial have varying real and imaginary components, with corresponding moduli and frequencies.
### Interpretation
The ARIMA model results provide insights into the time series behavior of "D.Close". The model attempts to capture the autocorrelation structure in the data using four lagged terms. However, the high p-values for most of the autoregressive coefficients suggest that these lags may not be strong predictors of the current value of "D.Close". The roots analysis provides information about the stability and oscillatory behavior of the time series. The moduli of the roots are all greater than 1, suggesting that the model is stationary. The frequencies indicate the cyclical patterns present in the data.