\n
## Statistical Output: ARIMA Model Results
### Overview
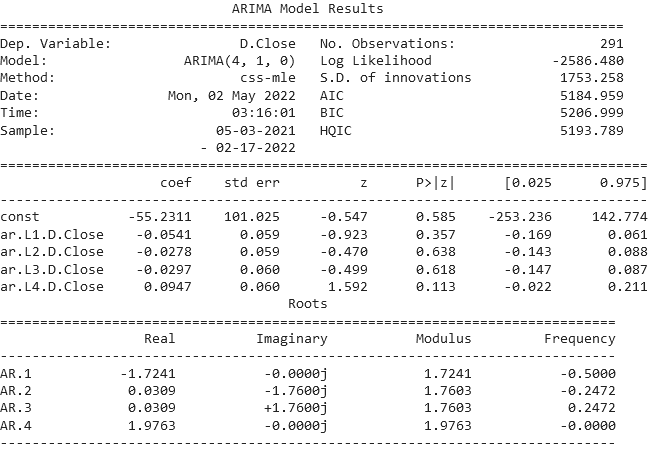
This image presents the results of an ARIMA (Autoregressive Integrated Moving Average) model applied to time series data. The output details model parameters, statistical tests, and root analysis. The data appears to be financial, specifically "D.Close" (presumably Daily Close price).
### Components/Axes
The output is structured into several sections:
* **Model Information:** Includes dependent variable, model specification (ARIMA(4,1,0)), method (css-mle), date, time, and sample period.
* **Model Fit Statistics:** Provides metrics like No. Observations, Log Likelihood, S.D. of innovations, AIC, BIC, and HQIC.
* **Parameter Estimates:** A table displaying coefficients (coef), standard errors (std err), z-statistics (z), p-values (P>|z|), and confidence intervals ([0.025, 0.975]) for each model parameter.
* **Root Analysis:** A table showing the real, imaginary, modulus, and frequency components of the roots of the characteristic polynomial.
### Detailed Analysis or Content Details
**Model Information:**
* Dependent Variable: D.Close
* Model: ARIMA(4, 1, 0)
* Method: css-mle
* Date: Mon, 02 May 2022
* Time: 03:16:01
* Sample: 05-03-2021 - 02-17-2022
* No. Observations: 291
* Log Likelihood: -2586.480
* S.D. of innovations: 1753.258
* AIC: 5184.959
* BIC: 5206.999
* HQIC: 5193.789
**Parameter Estimates:**
| Parameter | coef | std err | z | P>|z| | [0.025 | 0.975 |
|-----------|---------|---------|--------|-------|-------|----------|----------|
| const | -55.2311| 101.025 | -0.547 | 0.585 | -253.236| 142.774 |
| ar.L1.D.Close | -0.0541 | 0.059 | -0.923 | 0.357 | -0.169 | 0.061 |
| ar.L2.D.Close | -0.0278 | 0.059 | -0.470 | 0.638 | -0.143 | 0.088 |
| ar.L3.D.Close | -0.0297 | 0.060 | -0.499 | 0.618 | -0.147 | 0.087 |
| ar.L4.D.Close | 0.0947 | 0.060 | 1.592 | 0.113 | -0.022 | 0.211 |
**Root Analysis:**
| Root | Real | Imaginary | Modulus | Frequency |
|-------|---------|-----------|---------|-----------|
| AR.1 | -1.7241 | -0.0000j | 1.7241 | -0.5000 |
| AR.2 | 0.0309 | -1.7600j | 1.7603 | -0.2472 |
| AR.3 | 0.0309 | +1.7600j | 1.7603 | 0.2472 |
| AR.4 | 1.9763 | -0.0000j | 1.9763 | -0.0000 |
*Note: 'j' denotes the imaginary unit.*
### Key Observations
* The p-values for all AR coefficients are relatively high (greater than 0.05), suggesting that these coefficients are not statistically significant at the 5% level.
* The constant term also has a high p-value, indicating it's not statistically significant.
* The roots of the characteristic polynomial have moduli greater than 1, indicating that the ARIMA model is stationary.
* The imaginary components of AR.2 and AR.3 roots are non-zero, indicating oscillatory behavior.
### Interpretation
The ARIMA(4,1,0) model was fitted to the daily closing price (D.Close) time series data from March 5, 2021, to February 17, 2022. The model attempts to capture the autocorrelation structure in the data using four autoregressive (AR) terms. However, the statistical significance of the estimated coefficients is questionable, as indicated by the high p-values. This suggests that the model may not be a good fit for the data, or that a simpler model might be sufficient.
The root analysis confirms the stationarity of the model, which is a necessary condition for valid inference. The presence of complex roots (AR.2 and AR.3) indicates that the time series exhibits some oscillatory behavior. The relatively large standard errors of the coefficients suggest that the estimates are imprecise, potentially due to a limited sample size or high noise in the data. The AIC, BIC, and HQIC values provide measures of model fit, but their interpretation requires comparison with other potential models. The negative log-likelihood suggests the model is attempting to fit the data, but the high AIC/BIC/HQIC values suggest it may not be doing so efficiently.