## Statistical Output: ARIMA Model Results
### Overview
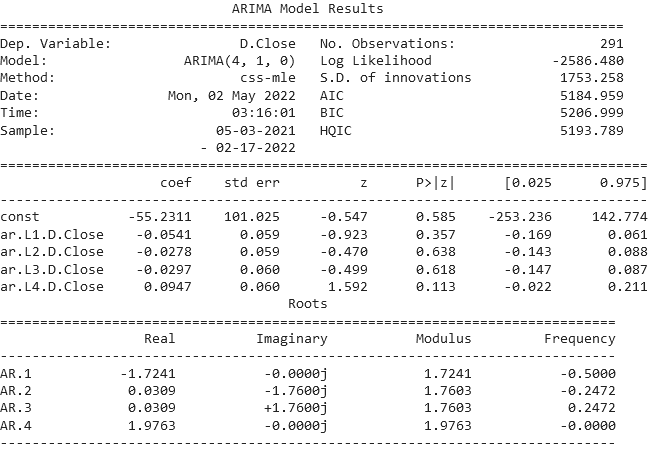
The image displays the textual output of a statistical model fitting, specifically an ARIMA (Autoregressive Integrated Moving Average) model. The output is presented in a monospaced font, typical of console or log output from statistical software. It contains three distinct sections: a header with model metadata, a table of estimated coefficients with their statistics, and a table of the model's autoregressive (AR) roots.
### Components/Axes
The output is structured into three main components:
1. **Header Section:** Contains metadata about the model and the data.
* **Dep. Variable:** `D.Close` (The dependent variable is the differenced closing price).
* **Model:** `ARIMA(4, 1, 0)` (An ARIMA model with 4 autoregressive terms, 1 degree of differencing, and 0 moving average terms).
* **Method:** `css-mle` (Conditional Sum of Squares - Maximum Likelihood Estimation).
* **Date/Time:** `Mon, 02 May 2022`, `03:16:01`.
* **Sample:** `05-03-2021 - 02-17-2022` (The date range of the data used for fitting).
* **No. Observations:** `291`.
* **Log Likelihood:** `-2586.480`.
* **S.D. of innovations:** `1753.258`.
* **AIC:** `5184.959` (Akaike Information Criterion).
* **BIC:** `5206.999` (Bayesian Information Criterion).
* **HQIC:** `5193.789` (Hannan-Quinn Information Criterion).
2. **Coefficients Table:** A table with 7 columns and 5 rows (including the header row).
* **Columns:** `coef`, `std err`, `z`, `P>|z|`, `[0.025`, `0.975]`.
* **Rows (Variables):**
* `const`: Constant term.
* `ar.L1.D.Close`: First lag of the differenced dependent variable.
* `ar.L2.D.Close`: Second lag.
* `ar.L3.D.Close`: Third lag.
* `ar.L4.D.Close`: Fourth lag.
3. **Roots Table:** A table describing the properties of the autoregressive polynomial's roots.
* **Columns:** `Real`, `Imaginary`, `Modulus`, `Frequency`.
* **Rows (Roots):** `AR.1`, `AR.2`, `AR.3`, `AR.4`.
### Detailed Analysis
**Coefficients Table Data:**
| Variable | coef | std err | z | P>\|z\| | [0.025 | 0.975] |
| :--- | :--- | :--- | :--- | :--- | :--- | :--- |
| const | -55.2311 | 101.025 | -0.547 | 0.585 | -253.236 | 142.774 |
| ar.L1.D.Close | -0.0541 | 0.059 | -0.923 | 0.357 | -0.169 | 0.061 |
| ar.L2.D.Close | -0.0278 | 0.059 | -0.470 | 0.638 | -0.143 | 0.088 |
| ar.L3.D.Close | -0.0297 | 0.060 | -0.499 | 0.618 | -0.147 | 0.087 |
| ar.L4.D.Close | 0.0947 | 0.060 | 1.592 | 0.113 | -0.022 | 0.211 |
**Roots Table Data:**
| Root | Real | Imaginary | Modulus | Frequency |
| :--- | :--- | :--- | :--- | :--- |
| AR.1 | -1.7241 | -0.0000j | 1.7241 | -0.5000 |
| AR.2 | 0.0309 | -1.7600j | 1.7603 | -0.2472 |
| AR.3 | 0.0309 | +1.7600j | 1.7603 | 0.2472 |
| AR.4 | 1.9763 | -0.0000j | 1.9763 | -0.0000 |
### Key Observations
1. **Model Specification:** The model is an ARIMA(4,1,0), meaning it uses four past values of the *differenced* series (`D.Close`) to predict its next value, with no moving average component.
2. **Coefficient Significance:** None of the estimated coefficients (including the constant) are statistically significant at the conventional 5% level (`P > |z| > 0.05`). The highest absolute z-statistic is 1.592 for the fourth lag (`ar.L4.D.Close`), with a p-value of 0.113.
3. **Roots and Stationarity:** All four AR roots have a modulus greater than 1 (ranging from 1.7241 to 1.9763). This indicates the AR polynomial is stationary, which is a required property for a valid ARIMA model. The presence of complex roots (AR.2 and AR.3) suggests potential cyclical behavior in the model's dynamics.
4. **Data Range:** The model was fitted on 291 observations of daily data (implied by the date format) spanning from May 3, 2021, to February 17, 2022.
5. **Fit Statistics:** The AIC, BIC, and HQIC values are provided for model comparison. The standard deviation of the innovations (residuals) is approximately 1753.26, indicating the scale of the model's prediction errors.
### Interpretation
This output represents the results of fitting a linear time series model to financial data (likely a stock or index closing price, given the variable name `Close`). The primary finding is that a simple ARIMA(4,1,0) model does not find strong, statistically significant autoregressive patterns in the differenced data over this specific period. The lack of significant coefficients suggests that the past four days' price changes do not have a reliable linear relationship with the next day's change, according to this model.
The stationarity of the roots confirms the model's mathematical validity but does not imply good predictive power. The high p-values for all coefficients indicate that this specific model structure may be overfit or that the underlying data is largely unpredictable using this linear method. A practitioner would likely use these results to conclude that this ARIMA specification is not useful for forecasting and would experiment with different lag orders, include moving average terms, or consider alternative, possibly non-linear, models. The large standard error of the constant term and the wide confidence intervals for all coefficients further underscore the uncertainty in these estimates.