# Technical Document Extraction: Token Embeddings Visualization
## Figure Caption
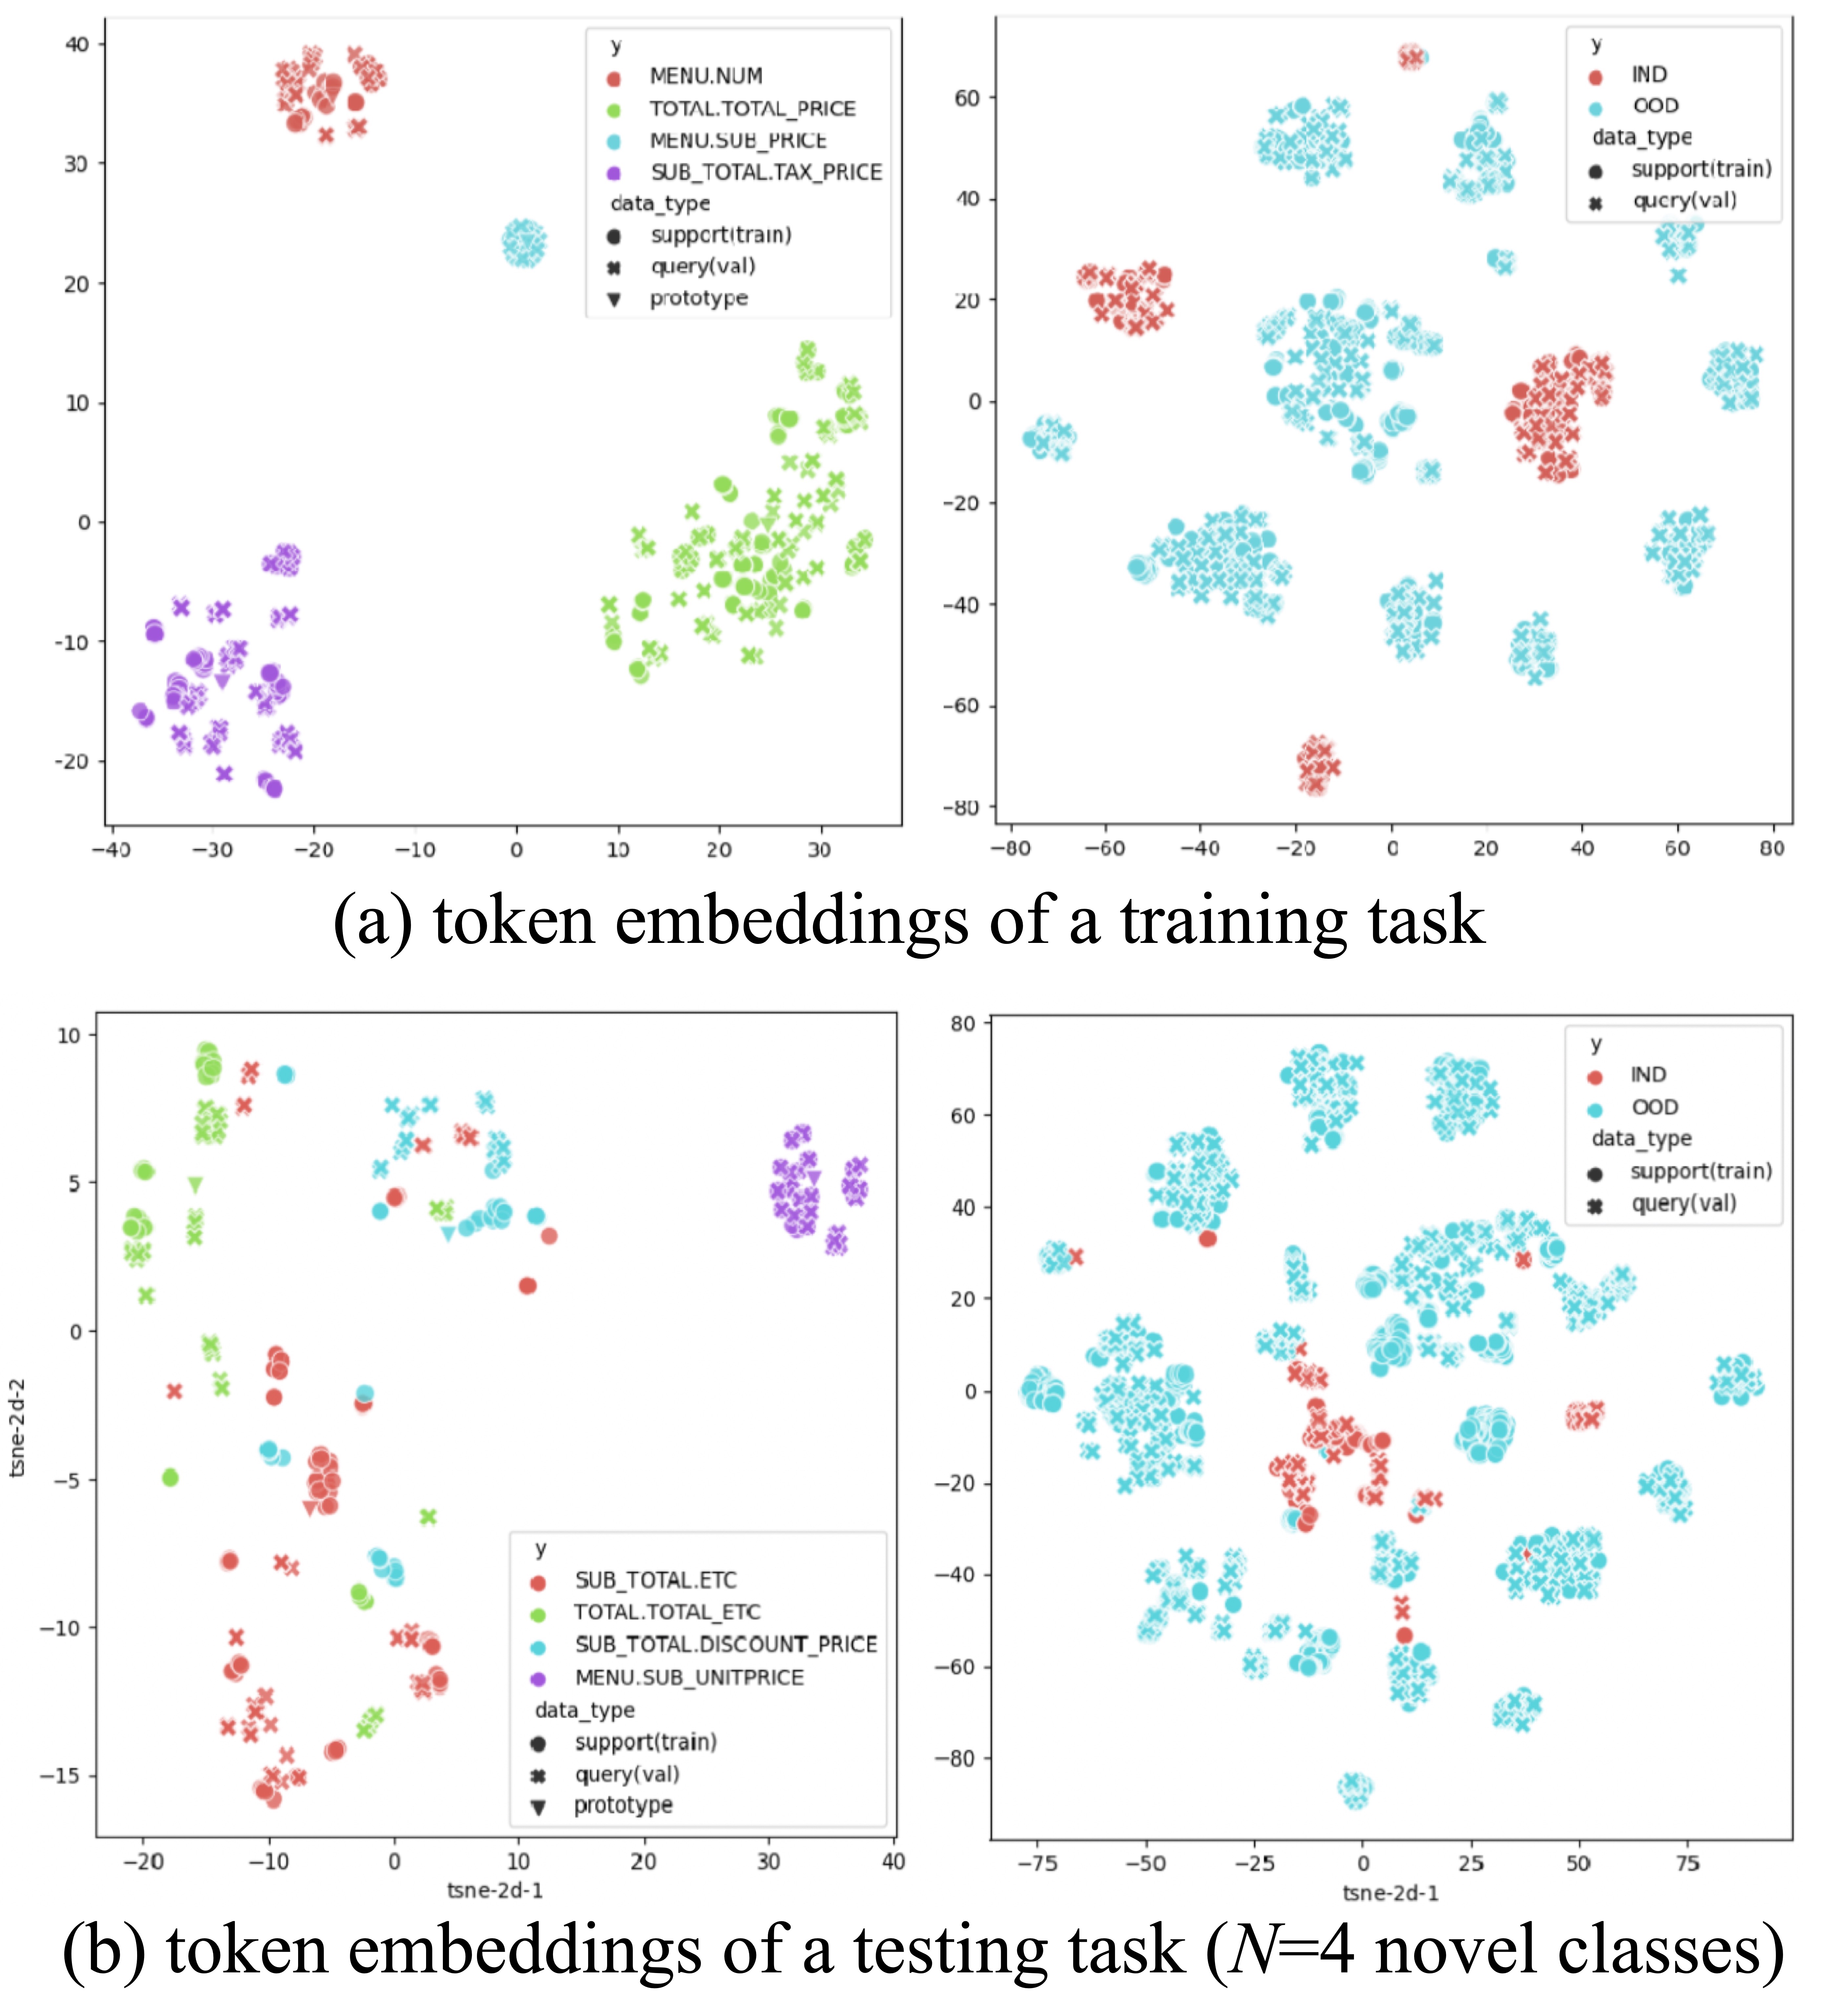
(a) token embeddings of a training task
(b) token embeddings of a testing task (N=4 novel classes)
---
### Plot (a) - Training Task Token Embeddings
#### Axes
- **X-axis**: tsne-2d-1 (range: -40 to 40)
- **Y-axis**: tsne-2d-2 (range: -20 to 40)
#### Legend (Right-Aligned)
| Color/Symbol | Label | Data Type |
|--------------|---------------------------|--------------------------|
| Red | MENU.NUM | |
| Green | TOTAL.TOTAL_PRICE | |
| Blue | MENU.SUB_PRICE | |
| Purple | SUB_TOTAL.TAX_PRICE | |
| Black Circle | support(train) | |
| Black Star | query(val) | |
| Black Triangle | prototype | |
#### Data Points & Trends
1. **Red (MENU.NUM)**: Clustered in the top-right quadrant (x: 10–30, y: 20–35).
2. **Green (TOTAL.TOTAL_PRICE)**: Scattered across the plot, with a dense cluster near x: 10–20, y: 10–20.
3. **Blue (MENU.SUB_PRICE)**: Concentrated in the bottom-right quadrant (x: 10–20, y: -10–0).
4. **Purple (SUB_TOTAL.TAX_PRICE)**: Located in the bottom-left quadrant (x: -30–-10, y: -20–-5).
5. **Black Symbols**:
- Circles (support(train)): Interspersed among red/green clusters.
- Stars (query(val)): Scattered near purple cluster.
- Triangles (prototype): Clustered near purple data points.
---
### Plot (b) - Testing Task Token Embeddings (N=4 Novel Classes)
#### Axes
- **X-axis**: tsne-2d-1 (range: -80 to 80)
- **Y-axis**: tsne-2d-2 (range: -80 to 60)
#### Legend (Right-Aligned)
| Color/Symbol | Label | Data Type |
|--------------|---------------------------|--------------------------|
| Red | IND | |
| Blue | OOD | |
| Black Circle | support(train) | |
| Black Star | query(val) | |
#### Data Points & Trends
1. **Red (IND)**: Clustered in the top-left quadrant (x: -60–-20, y: 20–40).
2. **Blue (OOD)**: Dominates the plot, with dense clusters in:
- Top-right (x: 20–60, y: 20–40)
- Bottom-left (x: -60–-20, y: -40–-20)
3. **Black Symbols**:
- Circles (support(train)): Interspersed among red/blue clusters.
- Stars (query(val)): Scattered near blue clusters.
---
### Plot (a) - Training Task (Alternative Dataset)
#### Axes
- **X-axis**: tsne-2d-1 (range: -20 to 40)
- **Y-axis**: tsne-2d-2 (range: -15 to 10)
#### Legend (Right-Aligned)
| Color/Symbol | Label | Data Type |
|--------------|---------------------------|--------------------------|
| Red | SUB_TOTAL.ETC | |
| Green | TOTAL.TOTAL_ETC | |
| Blue | SUB_TOTAL.DISCOUNT_PRICE | |
| Purple | MENU.SUB_UNITPRICE | |
| Black Circle | support(train) | |
| Black Star | query(val) | |
| Black Triangle | prototype | |
#### Data Points & Trends
1. **Red (SUB_TOTAL.ETC)**: Clustered in the top-right quadrant (x: 0–20, y: 5–10).
2. **Green (TOTAL.TOTAL_ETC)**: Scattered near x: -10–10, y: 0–5.
3. **Blue (SUB_TOTAL.DISCOUNT_PRICE)**: Located in the bottom-left quadrant (x: -20–0, y: -10–0).
4. **Purple (MENU.SUB_UNITPRICE)**: Clustered in the bottom-right quadrant (x: 10–30, y: -10–-5).
5. **Black Symbols**:
- Circles (support(train)): Interspersed among red/green clusters.
- Stars (query(val)): Scattered near purple cluster.
- Triangles (prototype): Clustered near purple data points.
---
### Plot (b) - Testing Task (Alternative Dataset)
#### Axes
- **X-axis**: tsne-2d-1 (range: -75 to 75)
- **Y-axis**: tsne-2d-2 (range: -80 to 60)
#### Legend (Right-Aligned)
| Color/Symbol | Label | Data Type |
|--------------|---------------------------|--------------------------|
| Red | IND | |
| Blue | OOD | |
| Green | SUB_TOTAL.ETC | |
| Purple | TOTAL.TOTAL_ETC | |
| Black Circle | support(train) | |
| Black Star | query(val) | |
#### Data Points & Trends
1. **Red (IND)**: Clustered in the top-left quadrant (x: -50–-10, y: 20–40).
2. **Blue (OOD)**: Dominates the plot, with dense clusters in:
- Top-right (x: 20–60, y: 20–40)
- Bottom-left (x: -60–-20, y: -40–-20)
3. **Green (SUB_TOTAL.ETC)**: Scattered near x: -10–10, y: 0–5.
4. **Purple (TOTAL.TOTAL_ETC)**: Clustered in the bottom-right quadrant (x: 10–30, y: -10–-5).
5. **Black Symbols**:
- Circles (support(train)): Interspersed among red/blue clusters.
- Stars (query(val)): Scattered near blue clusters.
---
### Cross-Reference Validation
- **Color Consistency**:
- Red in all plots corresponds to "IND" or "MENU.NUM" (context-dependent).
- Blue consistently represents "OOD" or "MENU.SUB_PRICE".
- **Spatial Grounding**:
- Legends are positioned on the right side of each plot.
- Axes labels (tsne-2d-1, tsne-2d-2) are consistent across all plots.
### Notes
- No non-English text detected.
- No data tables present; all information is conveyed via scatter plots and legends.
- Trends verified visually (e.g., cluster locations, symbol distributions).