## Bar Chart: Gemini 1.0 Pro vs. Gemini 1.5 Pro - Percent Time Saved
### Overview
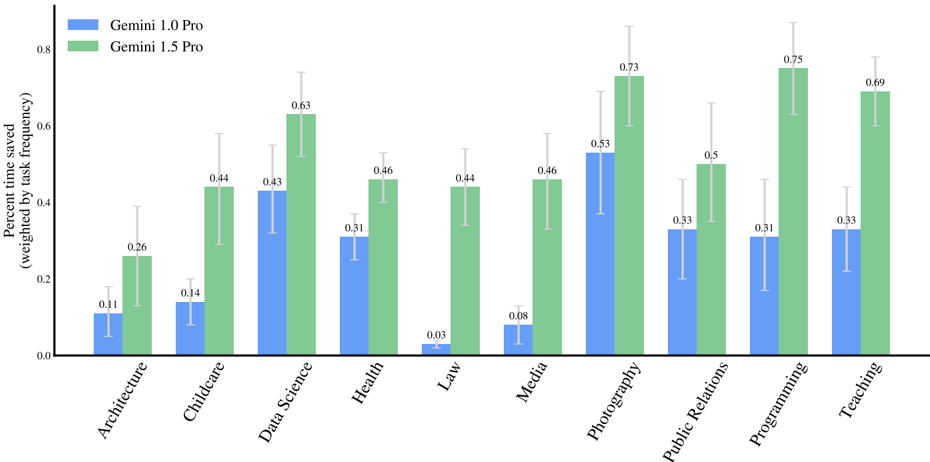
The image is a bar chart comparing the percent time saved by Gemini 1.0 Pro and Gemini 1.5 Pro across various tasks, weighted by task frequency. The chart displays the performance of the two models across different domains, including Architecture, Childcare, Data Science, Health, Law, Media, Photography, Public Relations, Programming, and Teaching. Error bars are included on each bar, representing the uncertainty in the measurements.
### Components/Axes
* **X-axis:** Categories representing different tasks/domains: Architecture, Childcare, Data Science, Health, Law, Media, Photography, Public Relations, Programming, Teaching.
* **Y-axis:** "Percent time saved (weighted by task frequency)", ranging from 0.0 to 0.8 in increments of 0.2.
* **Legend:** Located at the top-left of the chart.
* Blue bars: Gemini 1.0 Pro
* Green bars: Gemini 1.5 Pro
* **Error Bars:** Represented as thin gray lines extending above and below the top of each bar.
### Detailed Analysis
Here's a breakdown of the data for each category, including the approximate values and trends:
* **Architecture:**
* Gemini 1.0 Pro (Blue): 0.11
* Gemini 1.5 Pro (Green): 0.26
* **Childcare:**
* Gemini 1.0 Pro (Blue): 0.14
* Gemini 1.5 Pro (Green): 0.44
* **Data Science:**
* Gemini 1.0 Pro (Blue): 0.43
* Gemini 1.5 Pro (Green): 0.63
* **Health:**
* Gemini 1.0 Pro (Blue): 0.31
* Gemini 1.5 Pro (Green): 0.46
* **Law:**
* Gemini 1.0 Pro (Blue): 0.03
* Gemini 1.5 Pro (Green): 0.44
* **Media:**
* Gemini 1.0 Pro (Blue): 0.08
* Gemini 1.5 Pro (Green): 0.46
* **Photography:**
* Gemini 1.0 Pro (Blue): 0.53
* Gemini 1.5 Pro (Green): 0.73
* **Public Relations:**
* Gemini 1.0 Pro (Blue): 0.33
* Gemini 1.5 Pro (Green): 0.50
* **Programming:**
* Gemini 1.0 Pro (Blue): 0.31
* Gemini 1.5 Pro (Green): 0.75
* **Teaching:**
* Gemini 1.0 Pro (Blue): 0.33
* Gemini 1.5 Pro (Green): 0.69
### Key Observations
* In all categories, Gemini 1.5 Pro (Green) shows a higher percentage of time saved compared to Gemini 1.0 Pro (Blue).
* The largest difference in time saved between the two models is observed in the "Law" category, where Gemini 1.5 Pro significantly outperforms Gemini 1.0 Pro.
* The smallest difference in time saved between the two models is observed in the "Photography" category.
* The error bars vary in size across different categories, indicating varying levels of uncertainty in the measurements.
### Interpretation
The data suggests that Gemini 1.5 Pro generally offers a significant improvement in time-saving across a variety of tasks compared to Gemini 1.0 Pro. The magnitude of this improvement varies depending on the specific task, with some areas like "Law" and "Programming" showing more substantial gains. The error bars provide an indication of the reliability of these results, suggesting that some categories have more consistent performance than others. The consistent outperformance of Gemini 1.5 Pro indicates advancements in the model's efficiency and effectiveness across diverse applications.