\n
## Line Chart: Training Performance Metrics
### Overview
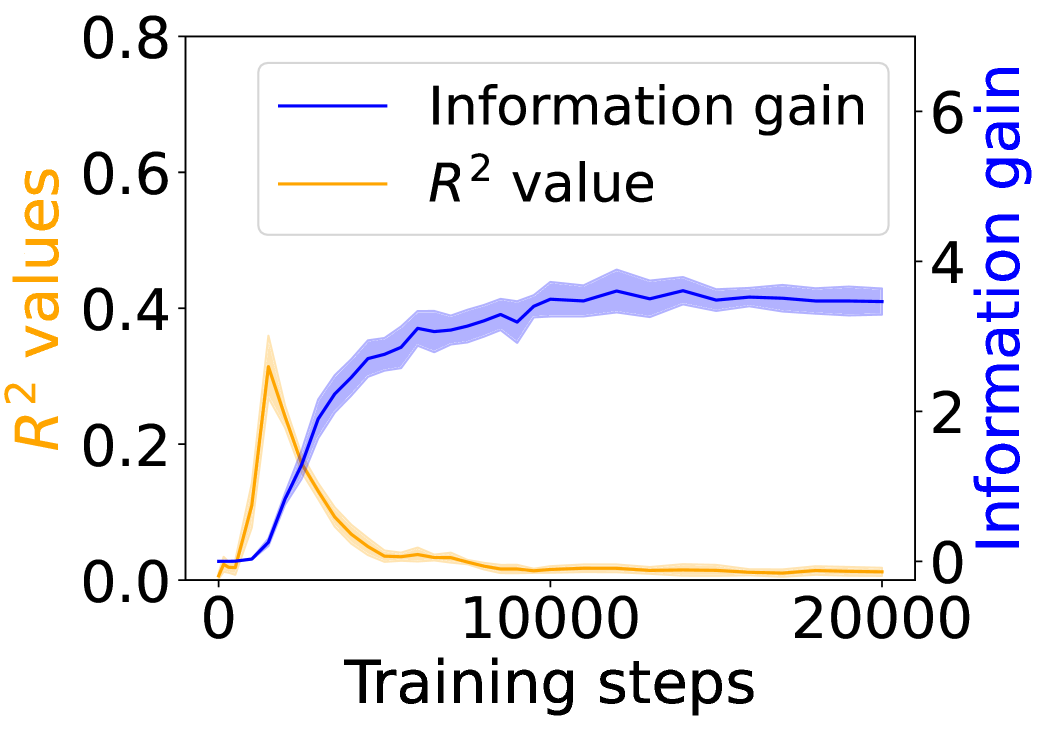
This image presents a line chart illustrating the training performance of a model, tracking both Information Gain and R² value over Training Steps. The chart displays two metrics against a common x-axis of "Training steps", but uses a dual y-axis to accommodate their different scales. A shaded region around the "Information gain" line indicates a measure of variance or confidence.
### Components/Axes
* **X-axis:** "Training steps", ranging from approximately 0 to 20000.
* **Left Y-axis:** "R² values", ranging from 0.0 to 0.8.
* **Right Y-axis:** "Information gain", ranging from 0 to 6.
* **Legend:** Located in the top-right corner, identifying the lines:
* "Information gain" (Blue)
* "R² value" (Orange)
* **Shaded Region:** A light blue shaded area surrounds the "Information gain" line, representing the standard deviation or confidence interval.
### Detailed Analysis
* **R² Value (Orange Line):** The R² value starts at approximately 0.0 at 0 training steps. It rapidly increases to a peak of around 0.25 at approximately 2500 training steps. After this peak, the R² value steadily declines, reaching approximately 0.05 by 20000 training steps.
* **Information Gain (Blue Line):** The Information Gain starts at approximately 0.0 at 0 training steps. It exhibits a relatively rapid increase, reaching around 3.5 at approximately 5000 training steps. The Information Gain then plateaus, fluctuating between approximately 3.5 and 4.5 for the remainder of the training period (up to 20000 steps). The shaded region around the line indicates that the Information Gain fluctuates between approximately 3.0 and 5.0.
### Key Observations
* The R² value initially increases with training, suggesting the model is initially learning and fitting the training data better. However, the subsequent decline indicates potential overfitting or diminishing returns from further training.
* The Information Gain shows a consistent increase and then stabilization, suggesting the model continues to acquire useful information during training, but the rate of information gain diminishes over time.
* The two metrics exhibit contrasting trends. While R² decreases after an initial increase, Information Gain continues to increase and stabilize.
### Interpretation
The chart suggests a typical training dynamic where a model initially improves its fit to the training data (as indicated by the rising R² value) and simultaneously gains information. However, the decreasing R² value after a certain point suggests that the model may be starting to overfit the training data, meaning it is learning the noise in the data rather than the underlying patterns. The continued increase in Information Gain, even as R² declines, could indicate that the model is still learning complex relationships, but these relationships may not generalize well to unseen data.
The contrasting trends of the two metrics highlight the importance of monitoring both fit (R²) and information acquisition (Information Gain) during model training. A decline in R² while Information Gain remains stable or increases could be a signal to stop training or to implement regularization techniques to prevent overfitting. The shaded region around the Information Gain line suggests that the model's learning process is not entirely deterministic and may be subject to some degree of randomness or variance.