## Line Chart: Average nDCG@10 vs. Training Steps
### Overview
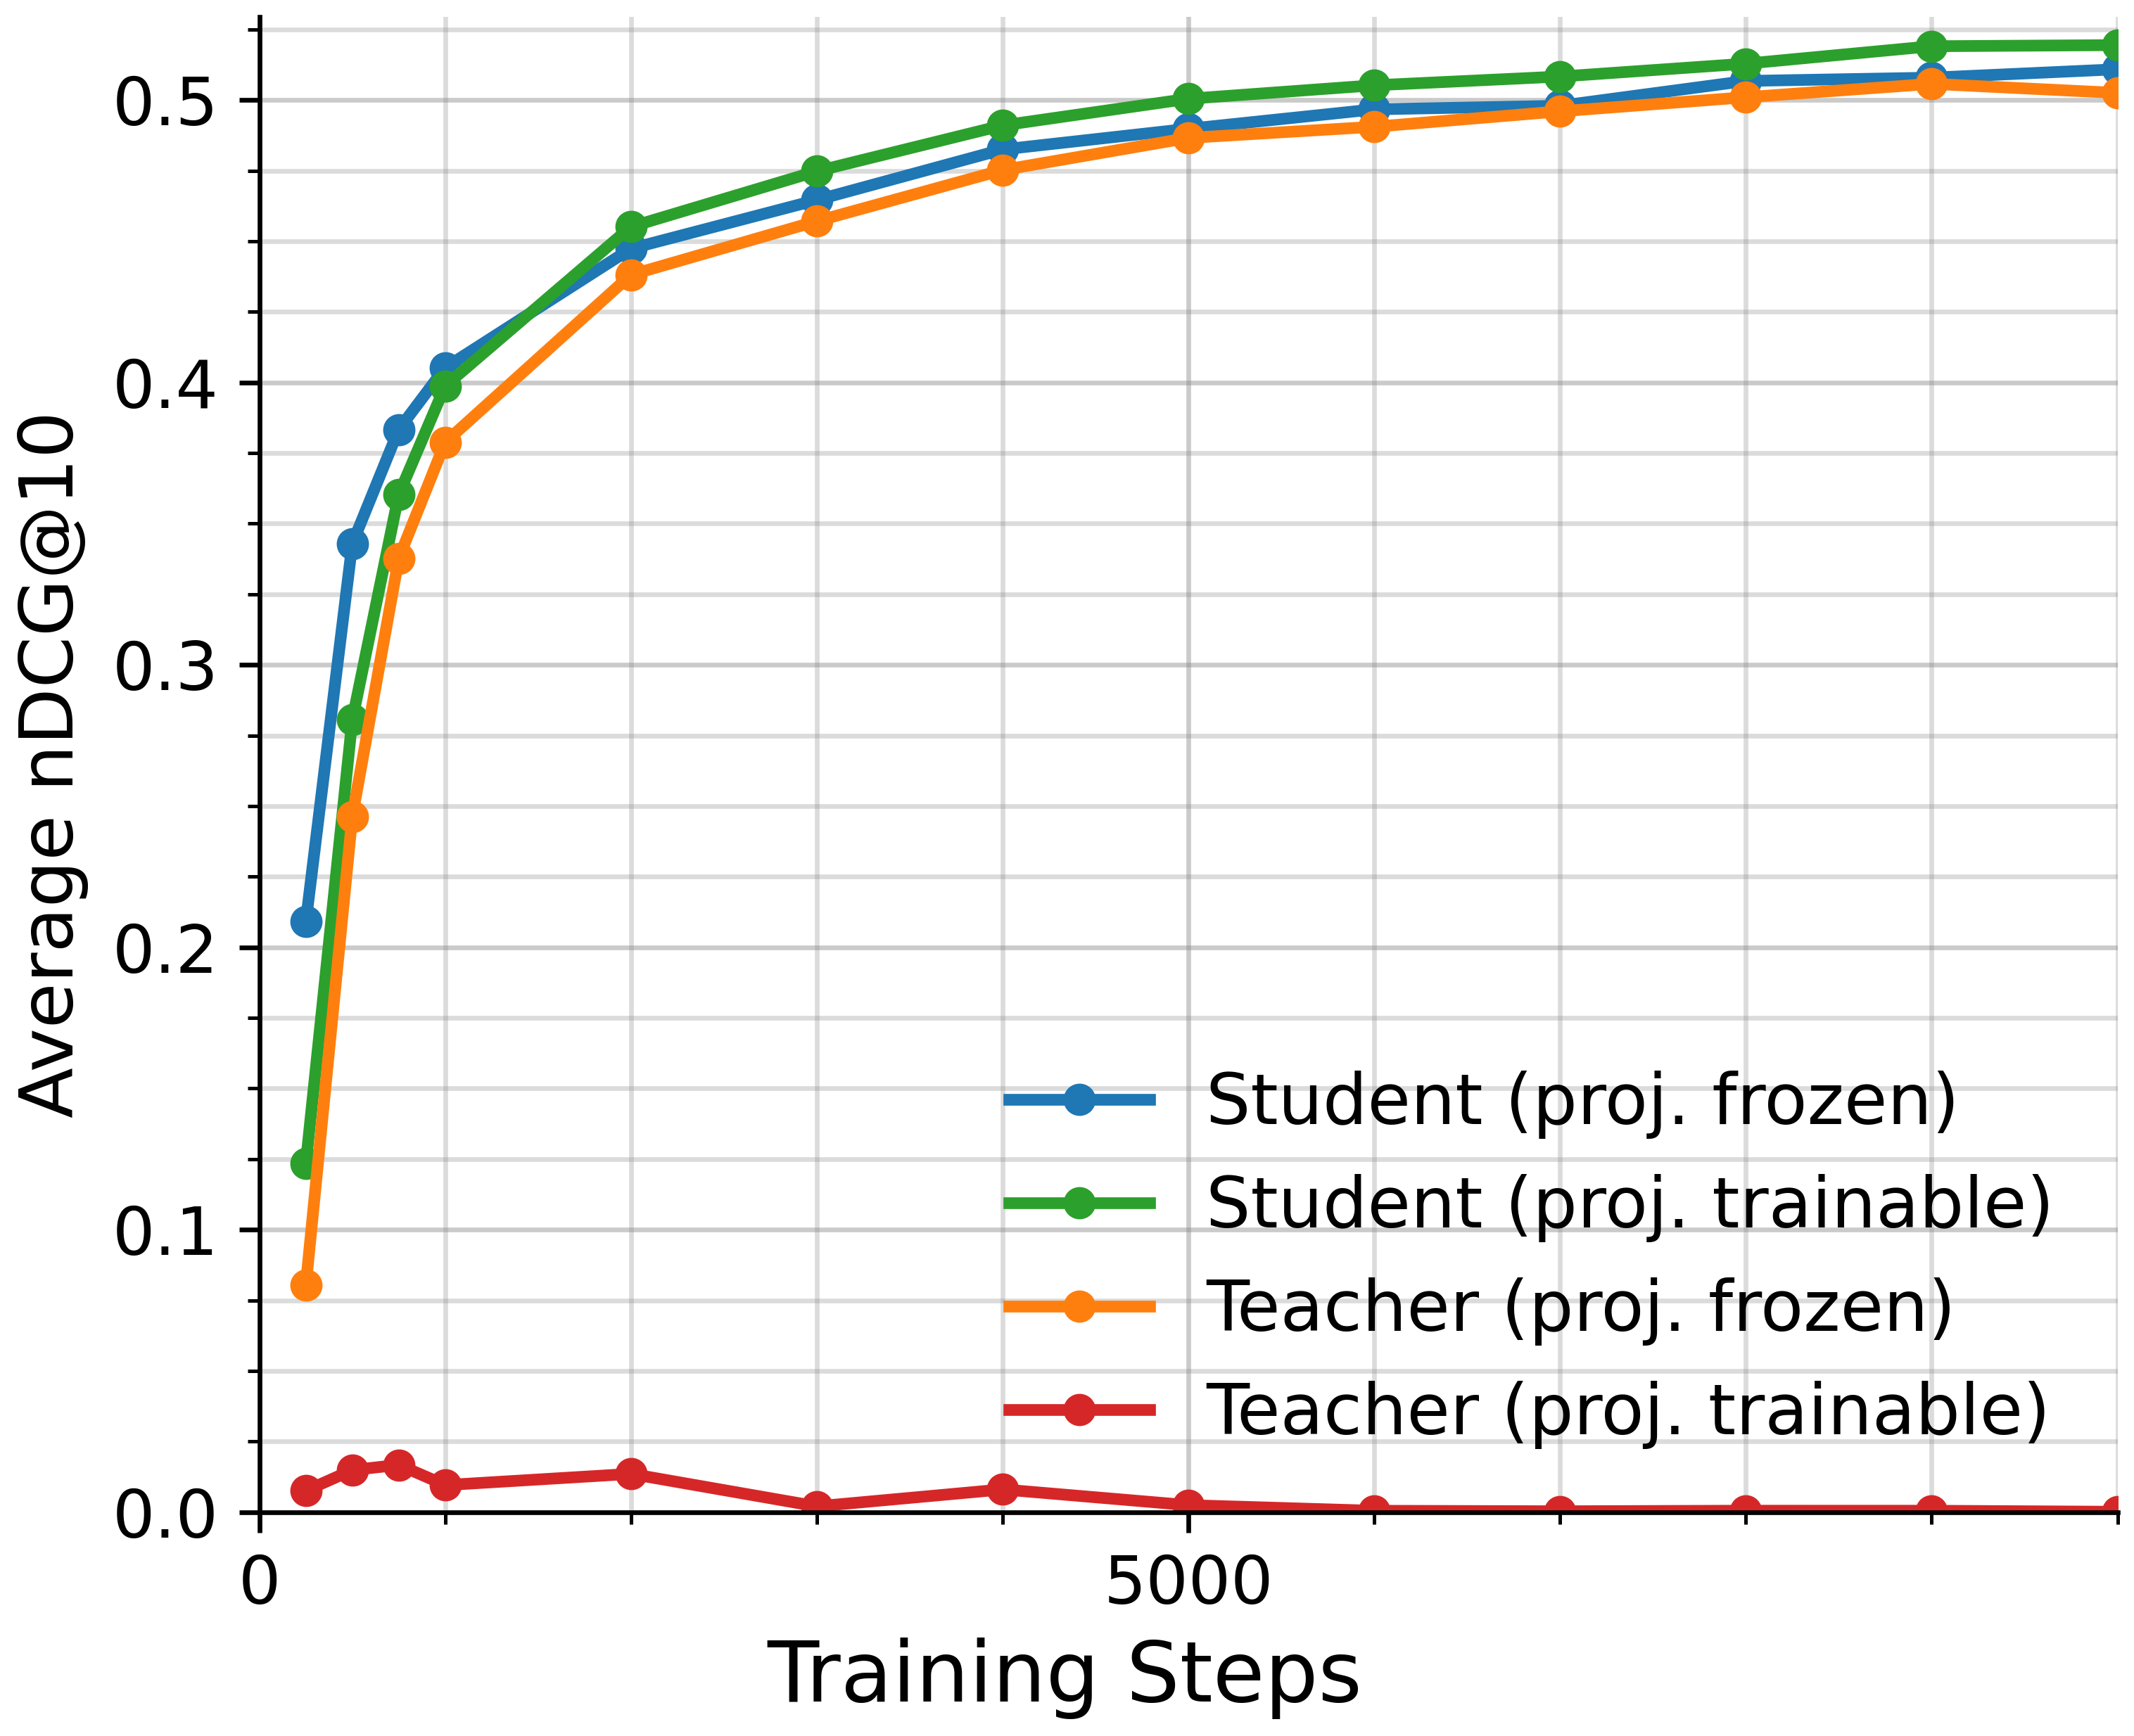
The image is a line chart comparing the performance of "Student" and "Teacher" models, with variations in whether their projection layers are "frozen" or "trainable," across different training steps. The y-axis represents the average nDCG@10 (Normalized Discounted Cumulative Gain at 10), a measure of ranking quality, and the x-axis represents the number of training steps.
### Components/Axes
* **X-axis:** Training Steps, ranging from 0 to approximately 10000, with a marked value at 5000.
* **Y-axis:** Average nDCG@10, ranging from 0.0 to 0.5, with marked values at 0.1, 0.2, 0.3, 0.4, and 0.5.
* **Legend (bottom-right):**
* Blue: Student (proj. frozen)
* Green: Student (proj. trainable)
* Orange: Teacher (proj. frozen)
* Red: Teacher (proj. trainable)
### Detailed Analysis
* **Student (proj. frozen) - Blue Line:**
* Trend: The line increases sharply initially, then plateaus.
* Data Points:
* At 0 Training Steps: ~0.21
* At ~1000 Training Steps: ~0.38
* At ~2000 Training Steps: ~0.42
* At 5000 Training Steps: ~0.48
* At 10000 Training Steps: ~0.51
* **Student (proj. trainable) - Green Line:**
* Trend: The line increases sharply initially, then plateaus.
* Data Points:
* At 0 Training Steps: ~0.12
* At ~1000 Training Steps: ~0.40
* At ~2000 Training Steps: ~0.45
* At 5000 Training Steps: ~0.50
* At 10000 Training Steps: ~0.52
* **Teacher (proj. frozen) - Orange Line:**
* Trend: The line increases sharply initially, then plateaus.
* Data Points:
* At 0 Training Steps: ~0.08
* At ~1000 Training Steps: ~0.35
* At ~2000 Training Steps: ~0.43
* At 5000 Training Steps: ~0.48
* At 10000 Training Steps: ~0.51
* **Teacher (proj. trainable) - Red Line:**
* Trend: The line remains relatively flat near zero.
* Data Points:
* At 0 Training Steps: ~0.01
* At 5000 Training Steps: ~0.005
* At 10000 Training Steps: ~0.001
### Key Observations
* The "Student" models (both frozen and trainable) outperform the "Teacher" models significantly.
* Making the projection layer trainable generally improves the performance of the "Student" model, especially in the initial training phase.
* The "Teacher" model with a trainable projection layer performs very poorly, remaining close to zero throughout the training process.
* All models except the "Teacher (proj. trainable)" model show a rapid increase in nDCG@10 in the early training stages, followed by a plateau.
### Interpretation
The data suggests that "Student" models are more effective than "Teacher" models in this particular setup. Allowing the projection layer to be trainable enhances the "Student" model's performance. The extremely poor performance of the "Teacher (proj. trainable)" model indicates a potential issue with the training process or model architecture when the teacher's projection layer is trainable. The plateauing of the nDCG@10 values for the other models suggests that further training steps may not yield significant improvements in ranking quality.