## Line Graph: Training Impact on nDCG@10
### Overview
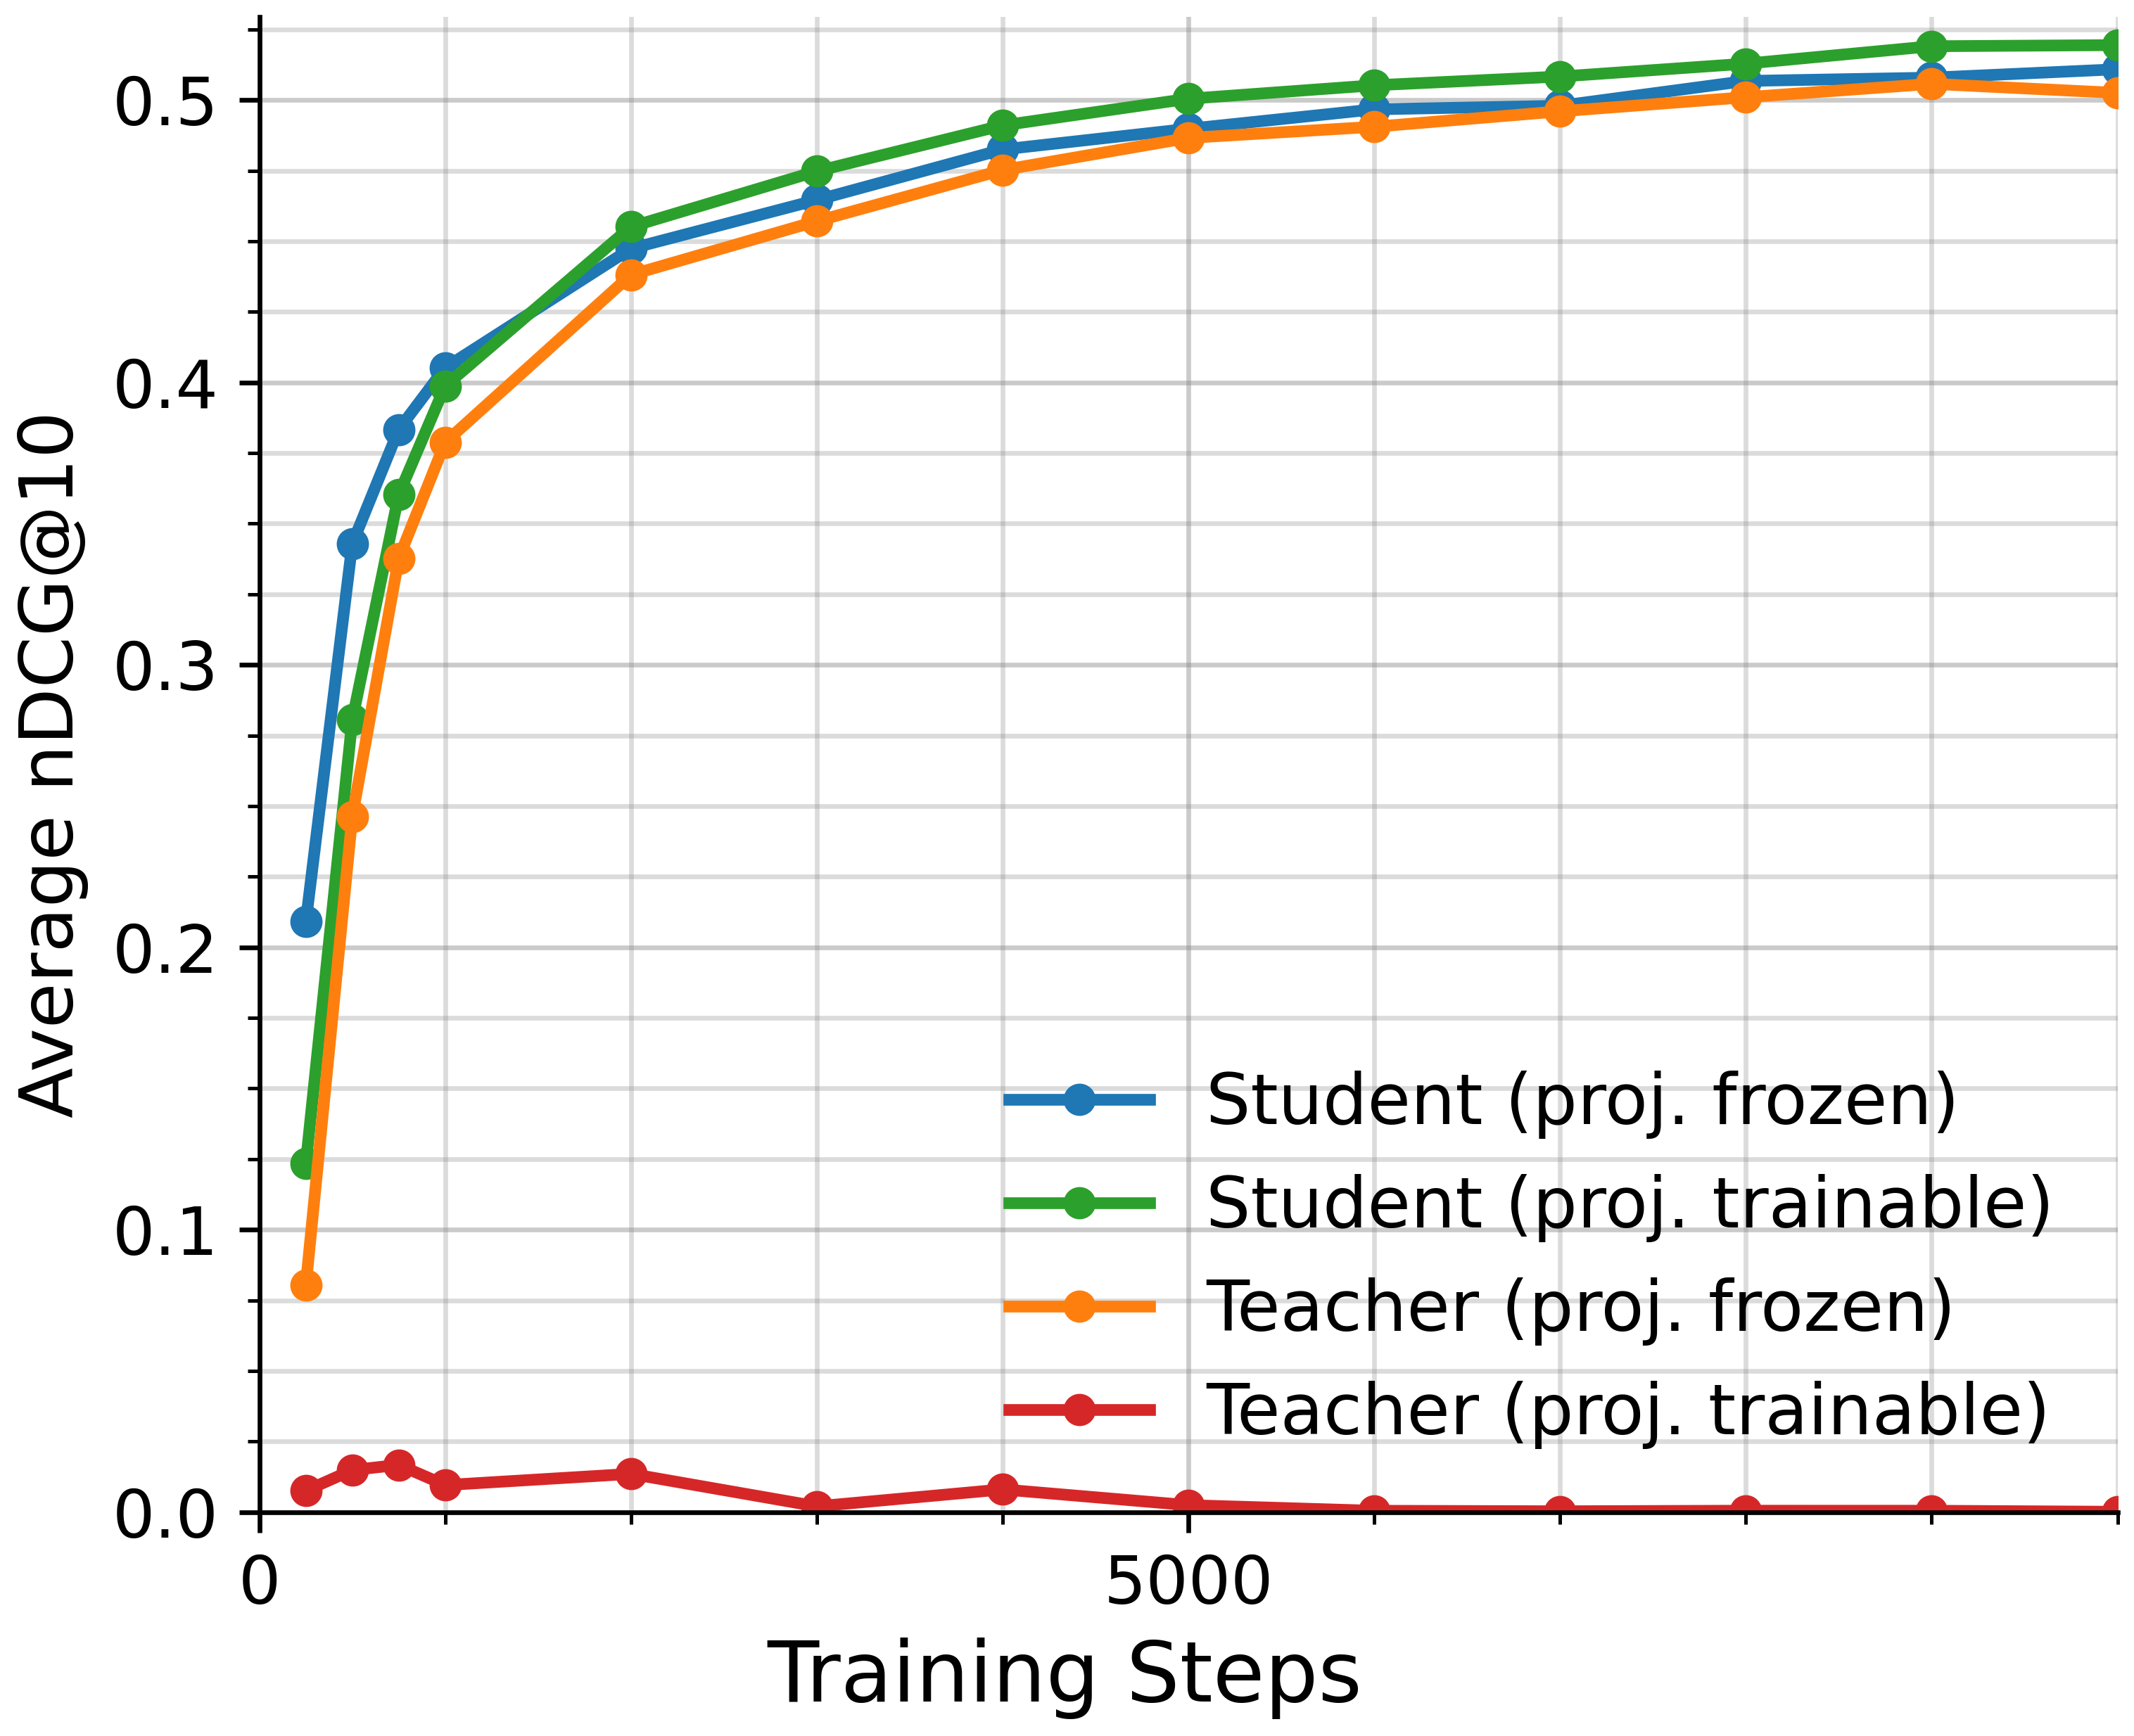
The line graph illustrates the impact of training steps on the average nDCG@10 metric for different models. The x-axis represents the number of training steps, while the y-axis shows the average nDCG@10 score.
### Components/Axes
- **X-axis**: Training Steps
- **Y-axis**: Average nDCG@10
- **Legend**:
- Student (proj. frozen)
- Student (proj. trainable)
- Teacher (proj. frozen)
- Teacher (proj. trainable)
### Detailed Analysis or ### Content Details
- **Student (proj. frozen)**: The line for Student (proj. frozen) shows a steady increase in nDCG@10, starting from around 0.1 and reaching approximately 0.5 after 5000 training steps.
- **Student (proj. trainable)**: The line for Student (proj. trainable) also increases, but at a slower rate compared to Student (proj. frozen). It starts from around 0.2 and reaches about 0.5 after 5000 training steps.
- **Teacher (proj. frozen)**: The line for Teacher (proj. frozen) shows a slight decrease in nDCG@10, starting from around 0.05 and reaching about 0.03 after 5000 training steps.
- **Teacher (proj. trainable)**: The line for Teacher (proj. trainable) remains relatively flat, indicating minimal change in nDCG@10, staying around 0.03 throughout the training process.
### Key Observations
- The Student (proj. trainable) model consistently outperforms the Student (proj. frozen) model across all training steps.
- The Teacher (proj. trainable) model shows the least improvement, with a slight decrease in nDCG@10.
- The Teacher (proj. frozen) model shows the most significant drop in performance.
### Interpretation
The data suggests that training the Student model (both frozen and trainable) leads to an improvement in the nDCG@10 metric, indicating better performance. The Teacher model, while trainable, shows minimal improvement, suggesting that the teacher model may not be as effective in this context. The slight decrease in the Teacher (proj. frozen) model could indicate overfitting or a need for regularization.