## Line Graph: Average nDCG@10 vs Training Steps
### Overview
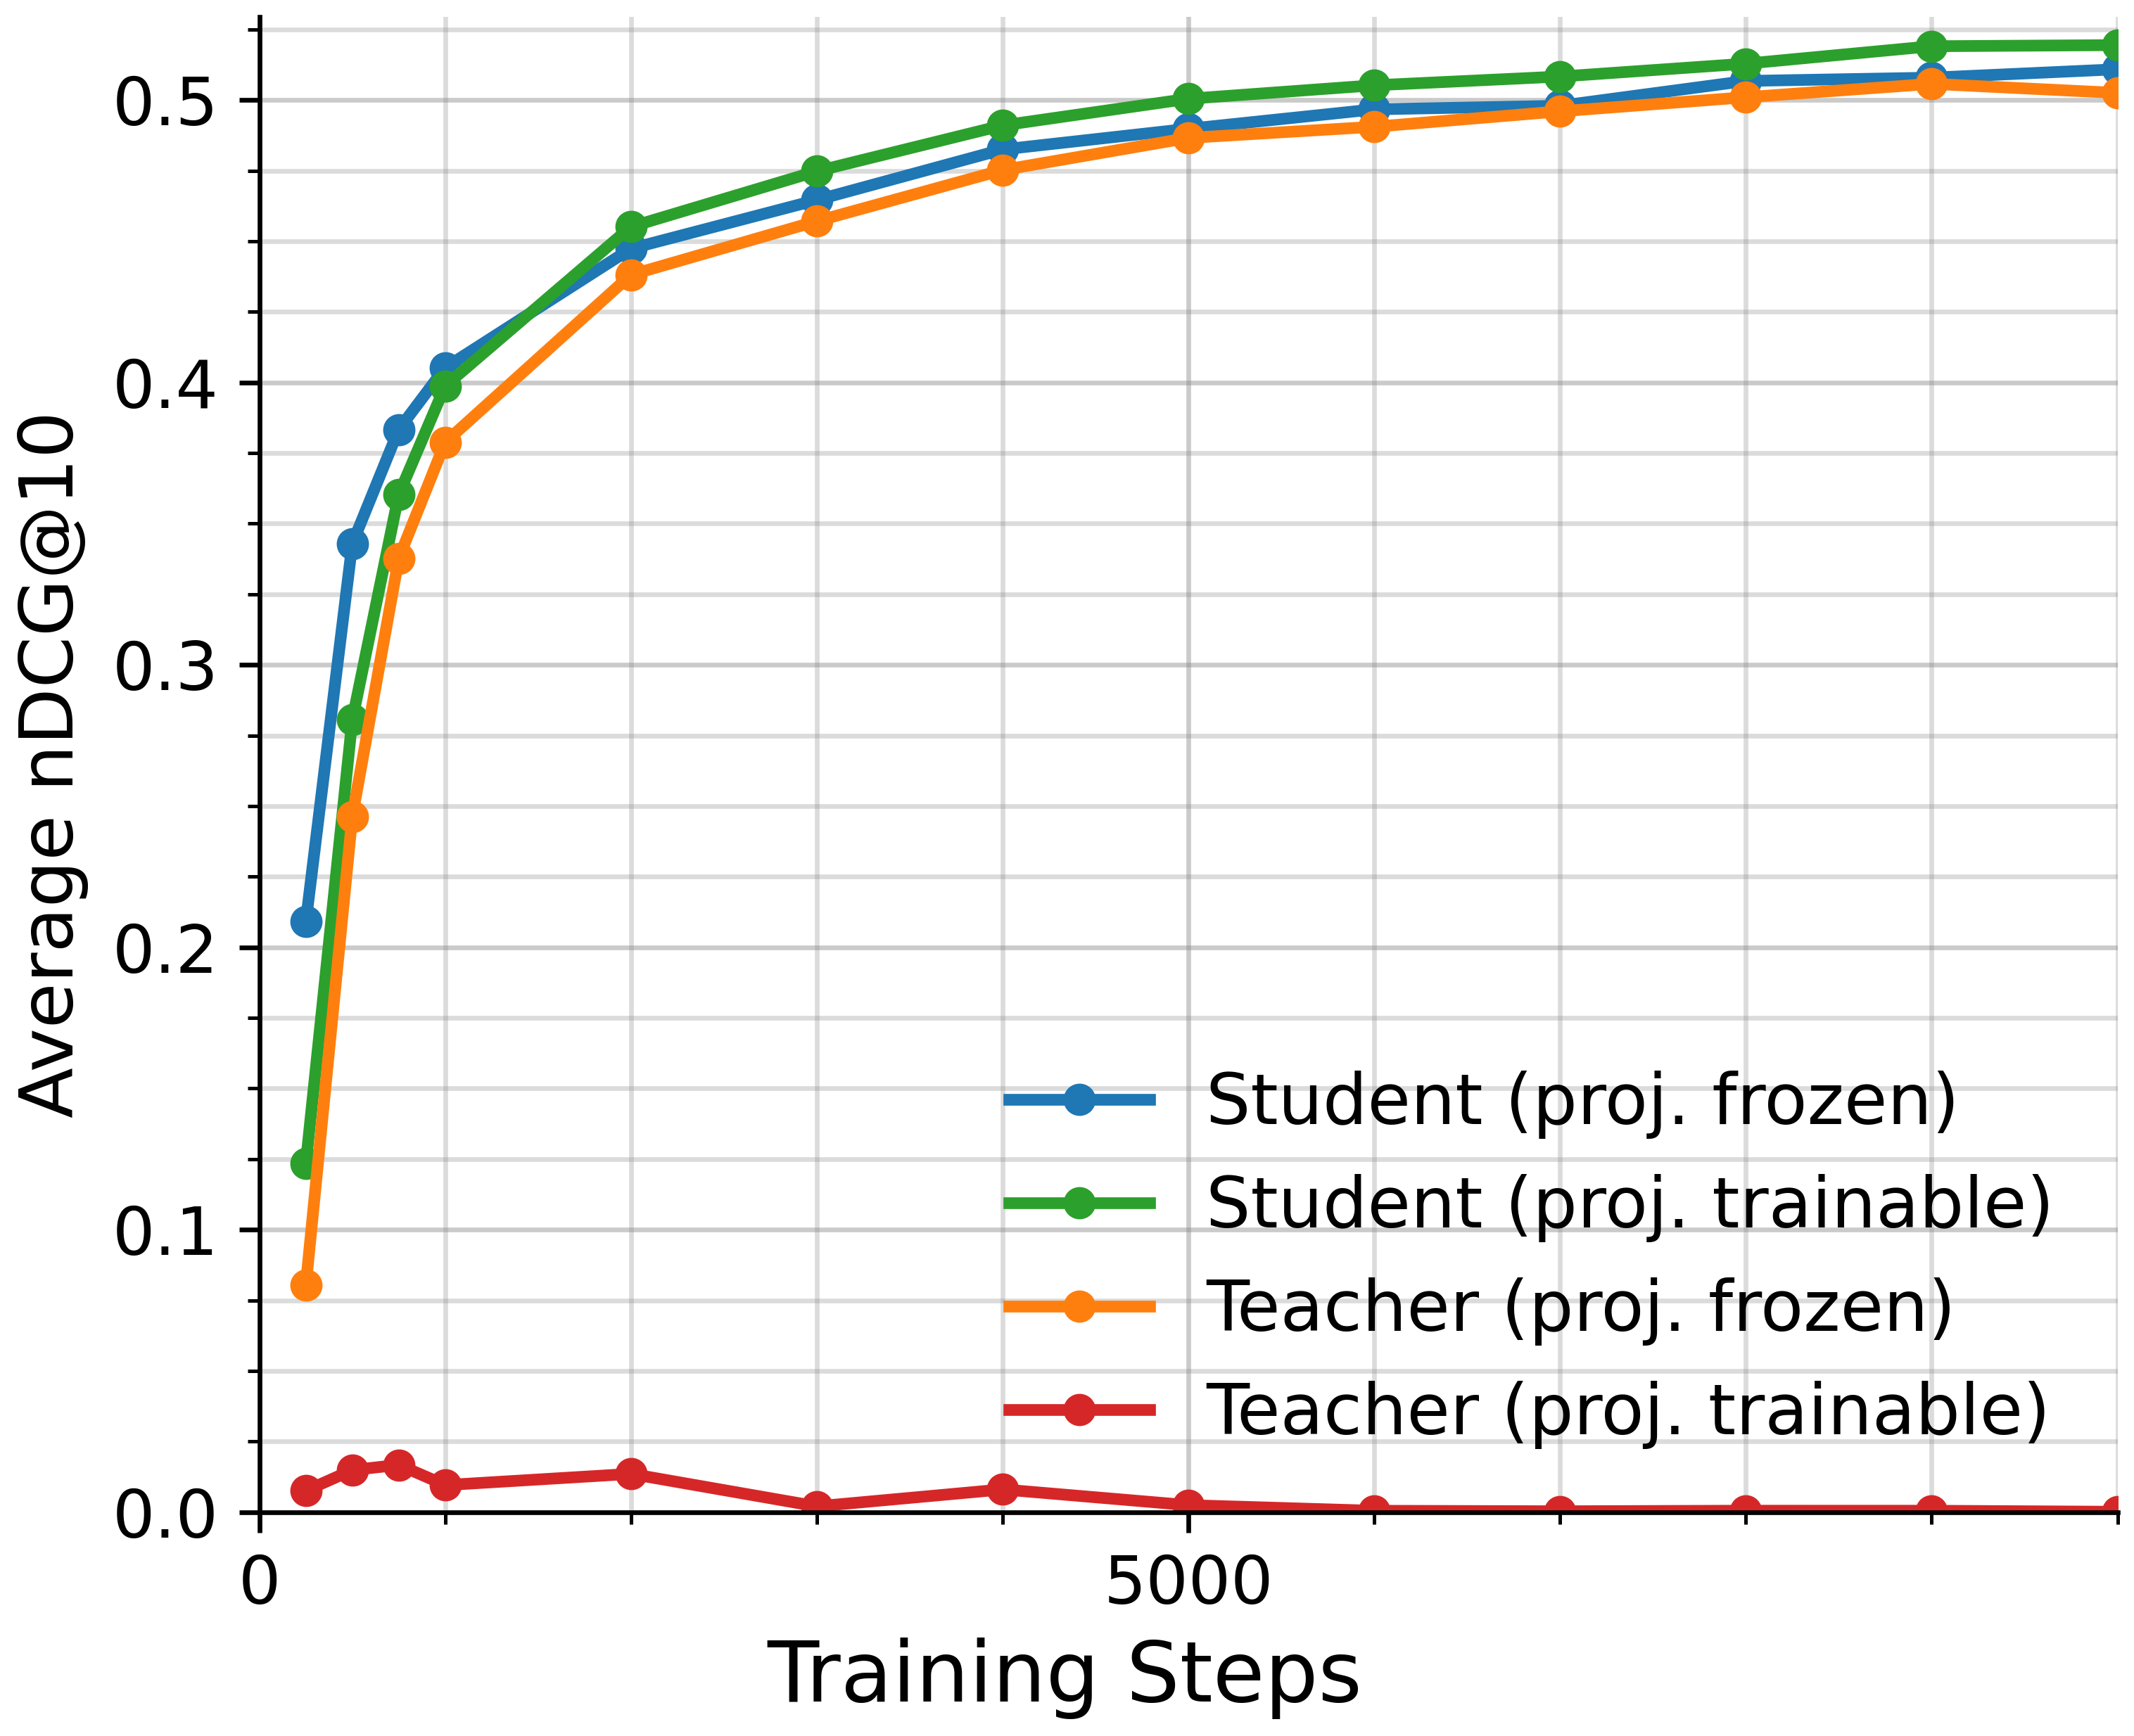
The graph depicts the performance of four models (Student and Teacher with frozen/trainable projections) across training steps, measured by average nDCG@10. All models show improvement over time, but with distinct trajectories.
### Components/Axes
- **X-axis**: Training Steps (0 to 10,000+)
- **Y-axis**: Average nDCG@10 (0.0 to 0.5)
- **Legend**:
- Blue: Student (proj. frozen)
- Green: Student (proj. trainable)
- Orange: Teacher (proj. frozen)
- Red: Teacher (proj. trainable)
### Detailed Analysis
1. **Student (proj. frozen)** (Blue):
- Starts at ~0.21 (step 0)
- Increases steadily to ~0.51 by 10,000 steps
- Slope: ~0.0003 per step
2. **Student (proj. trainable)** (Green):
- Starts at ~0.12 (step 0)
- Overtakes frozen Student at ~1,000 steps
- Reaches ~0.52 by 10,000 steps
- Slope: ~0.0004 per step
3. **Teacher (proj. frozen)** (Orange):
- Starts at ~0.08 (step 0)
- Gradual rise to ~0.50 by 10,000 steps
- Slope: ~0.0004 per step
4. **Teacher (proj. trainable)** (Red):
- Starts at ~0.0 (step 0)
- Minimal improvement (<0.01) across all steps
- Flatline after ~500 steps
### Key Observations
- Student (proj. trainable) outperforms all models after ~1,000 steps
- Teacher models show significantly lower performance overall
- Trainable projections enable faster convergence for Student models
- Teacher (proj. trainable) demonstrates near-zero learning capability
### Interpretation
The data suggests that trainable projections are critical for model improvement, particularly for Student architectures. The Teacher models' stagnation implies either inherent limitations or suboptimal training configurations. The Student (proj. trainable) achieving the highest nDCG@10 indicates that projection trainability enhances representation learning. The flat trajectory of Teacher (proj. trainable) raises questions about its training objective or initialization strategy.