## Bar Chart: Energy per Operation by Processor Type
### Overview
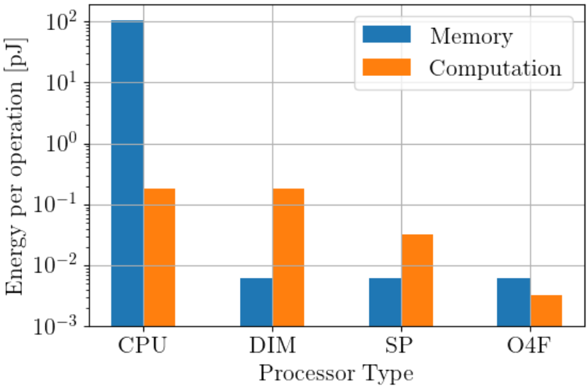
The image is a bar chart comparing the energy per operation (in picojoules) for memory and computation across four processor types: CPU, DIM, SP, and O4F. The y-axis uses a logarithmic scale.
### Components/Axes
* **X-axis:** Processor Type (CPU, DIM, SP, O4F)
* **Y-axis:** Energy per operation [pJ] (logarithmic scale)
* Axis markers: 10^-3, 10^-2, 10^-1, 10^0, 10^1, 10^2
* **Legend:** Located in the top-right corner.
* Blue: Memory
* Orange: Computation
### Detailed Analysis
* **CPU:**
* Memory (Blue): Approximately 100 pJ
* Computation (Orange): Approximately 0.2 pJ
* **DIM:**
* Memory (Blue): Approximately 0.006 pJ
* Computation (Orange): Approximately 0.15 pJ
* **SP:**
* Memory (Blue): Approximately 0.006 pJ
* Computation (Orange): Approximately 0.03 pJ
* **O4F:**
* Memory (Blue): Approximately 0.006 pJ
* Computation (Orange): Approximately 0.004 pJ
### Key Observations
* For the CPU, memory operations consume significantly more energy than computation.
* For DIM, SP, and O4F, computation consumes more energy than memory.
* CPU memory operations require substantially more energy than memory operations on the other processor types.
* The energy consumption for memory operations is roughly the same for DIM, SP, and O4F.
### Interpretation
The chart highlights the energy efficiency differences between processor types for memory and computation operations. The CPU exhibits a high energy cost for memory operations, suggesting it may be less efficient for memory-intensive tasks compared to DIM, SP, and O4F. The DIM, SP, and O4F processors show a lower energy footprint for memory but a higher relative cost for computation. This suggests they may be optimized for computational tasks while maintaining memory efficiency. The data suggests a trade-off between memory and computation energy efficiency across different processor architectures.