## Grouped Bar Chart: Energy per Operation by Processor Type
### Overview
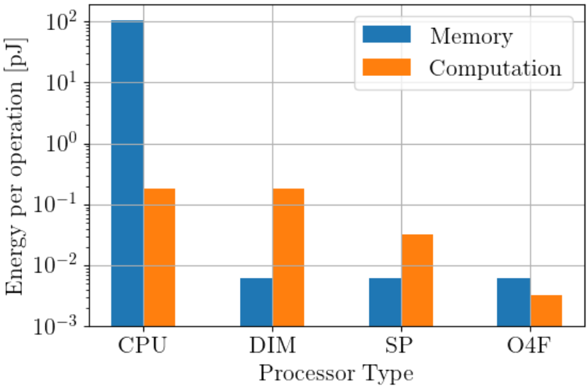
This is a grouped bar chart comparing the energy consumption, measured in picojoules (pJ) per operation, for four different processor types. The energy is broken down into two components: "Memory" and "Computation." The y-axis uses a logarithmic scale, indicating a very wide range of values.
### Components/Axes
* **Chart Type:** Grouped Bar Chart.
* **X-Axis (Horizontal):** Labeled "Processor Type." It lists four discrete categories:
1. CPU
2. DIM
3. SP
4. O4F
* **Y-Axis (Vertical):** Labeled "Energy per operation [pJ]." It is a **logarithmic scale** (base 10) ranging from 10⁻³ (0.001) to 10² (100) pJ. Major gridlines are at 10⁻³, 10⁻², 10⁻¹, 10⁰, 10¹, and 10².
* **Legend:** Positioned in the top-right corner of the chart area.
* **Blue Bar:** Represents "Memory" energy.
* **Orange Bar:** Represents "Computation" energy.
### Detailed Analysis
The chart presents paired bars (Memory/Computation) for each processor type. Values are approximate, read from the logarithmic scale.
**1. CPU:**
* **Memory (Blue):** The bar reaches the top of the chart, aligning with the 10² pJ gridline. **Value: ~100 pJ.**
* **Computation (Orange):** The bar is slightly above the 10⁻¹ pJ gridline. **Value: ~0.2 pJ.**
* **Trend:** Memory energy is dramatically higher (by about 3 orders of magnitude) than computation energy for the CPU.
**2. DIM:**
* **Memory (Blue):** The bar is between the 10⁻³ and 10⁻² pJ gridlines, closer to 10⁻². **Value: ~0.006 pJ.**
* **Computation (Orange):** The bar is at a similar height to the CPU's computation bar, slightly above 10⁻¹ pJ. **Value: ~0.2 pJ.**
* **Trend:** Memory energy is very low, while computation energy is comparable to the CPU's.
**3. SP:**
* **Memory (Blue):** The bar is at a similar height to the DIM's memory bar. **Value: ~0.006 pJ.**
* **Computation (Orange):** The bar is between the 10⁻² and 10⁻¹ pJ gridlines. **Value: ~0.03 pJ.**
* **Trend:** Memory energy remains very low. Computation energy is lower than that of the CPU and DIM.
**4. O4F:**
* **Memory (Blue):** The bar is at a similar height to the DIM and SP memory bars. **Value: ~0.006 pJ.**
* **Computation (Orange):** The bar is the lowest on the chart, between the 10⁻³ and 10⁻² pJ gridlines. **Value: ~0.003 pJ.**
* **Trend:** Memory energy is consistently low. Computation energy is the lowest among all processor types shown.
### Key Observations
1. **Dominant Energy Consumer in CPU:** For the CPU, memory operations consume vastly more energy (~100 pJ) than computation operations (~0.2 pJ), a difference of approximately 500x.
2. **Memory Energy Plateau:** The energy for memory operations drops by over four orders of magnitude from the CPU to the DIM, SP, and O4F processors, which all show similarly low values (~0.006 pJ).
3. **Computation Energy Trend:** Computation energy shows a general decreasing trend from CPU/DIM (~0.2 pJ) to SP (~0.03 pJ) to O4F (~0.003 pJ).
4. **O4F Efficiency:** The O4F processor demonstrates the lowest energy cost for both memory and computation operations among the types listed.
### Interpretation
This chart illustrates a fundamental principle in computer architecture: the energy cost of data movement (memory) often dwarfs the cost of actual calculation (computation), especially in general-purpose processors like the CPU shown here.
* The CPU's profile is classic, showing the "memory wall" problem where energy is dominated by accessing data.
* The DIM, SP, and O4F processors appear to be specialized architectures (e.g., in-memory processing, systolic arrays, or other accelerators) designed to drastically reduce the energy overhead of memory access. Their memory energy is nearly negligible compared to the CPU.
* The progression from CPU to O4F suggests an architectural evolution focused on minimizing both memory and computation energy, with O4F achieving the best overall efficiency for the operations measured.
* The data strongly argues for the use of specialized, domain-specific processors (like DIM, SP, O4F) over general-purpose CPUs for energy-constrained applications where the workload can be mapped to these architectures. The orders-of-magnitude reduction in memory energy is the most significant factor.