## Line Chart: Math Performance Comparison
### Overview
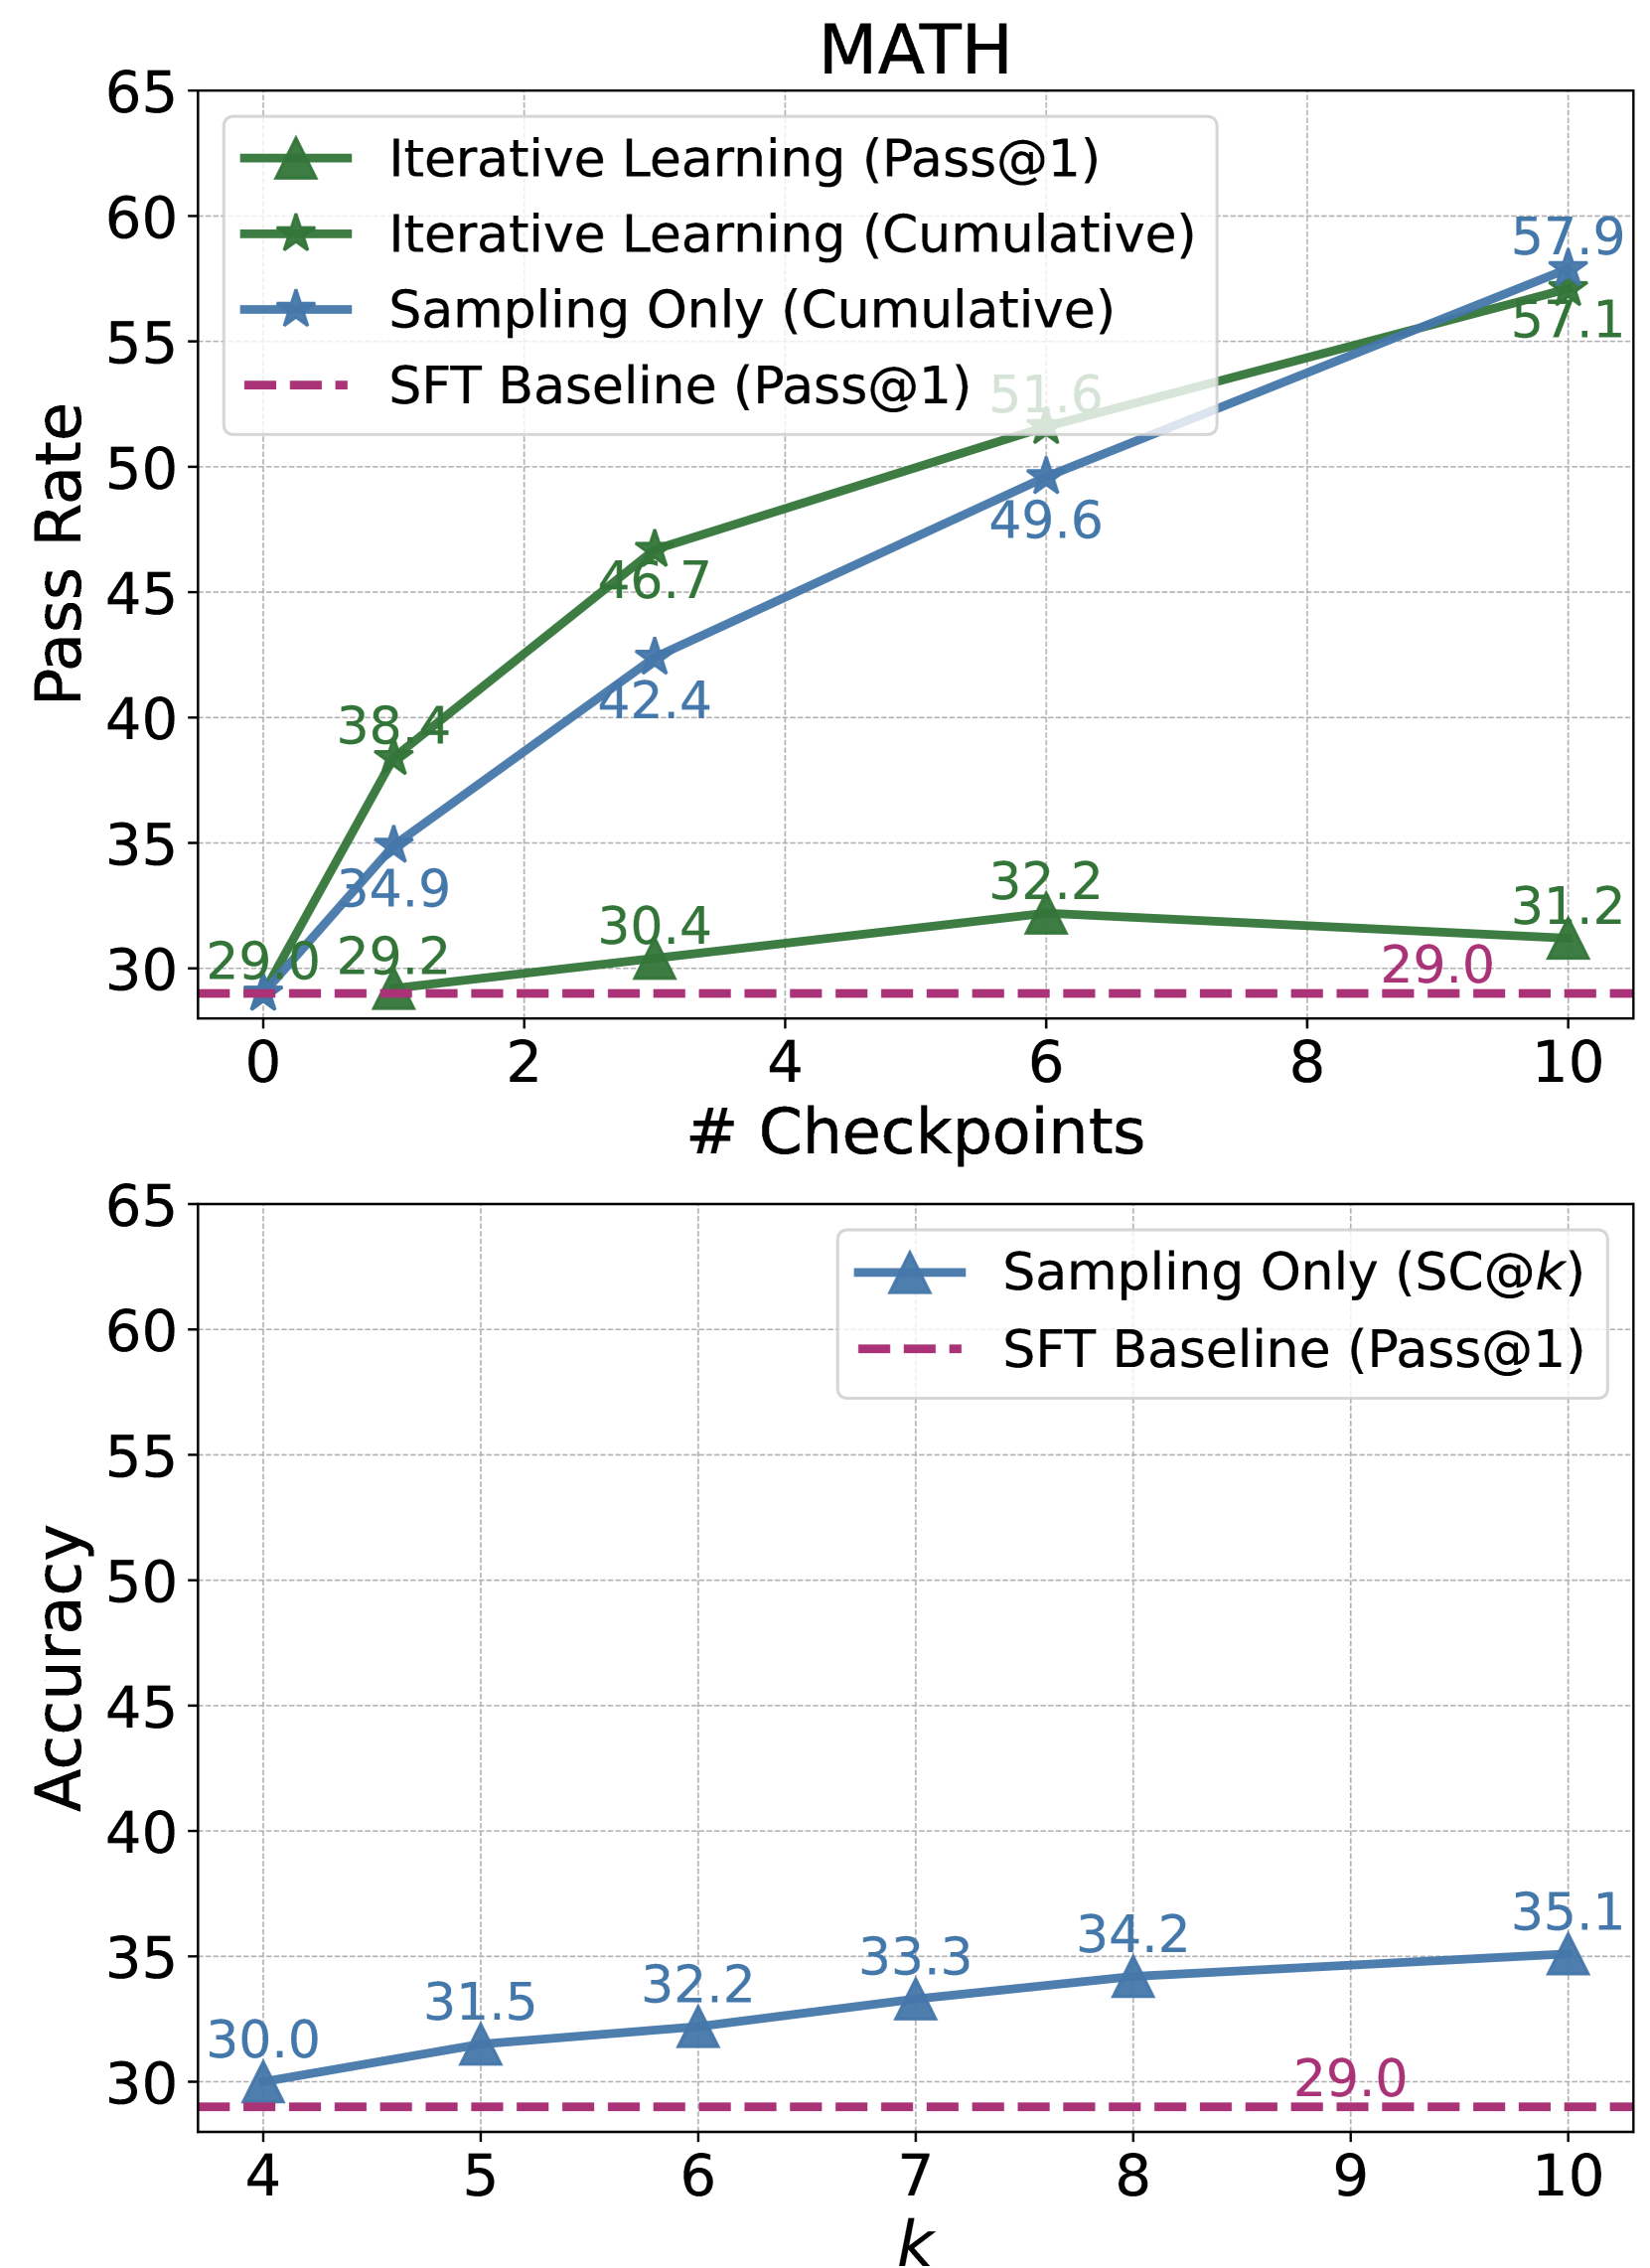
The image presents two line charts comparing the performance of different learning strategies on a math task. The top chart focuses on "Pass Rate" versus "# Checkpoints", while the bottom chart focuses on "Accuracy" versus "k". The learning strategies compared are "Iterative Learning", "Sampling Only", and "SFT Baseline".
### Components/Axes
**Top Chart:**
* **Title:** MATH
* **X-axis:** # Checkpoints (ranging from 0 to 10, with markers at 0, 2, 4, 6, 8, and 10)
* **Y-axis:** Pass Rate (ranging from 25 to 65, with markers at 25, 30, 35, 40, 45, 50, 55, 60, and 65)
* **Legend:**
* Iterative Learning (Pass@1) - Green triangles
* Iterative Learning (Cumulative) - Light Green line
* Sampling Only (Cumulative) - Teal line
* SFT Baseline (Pass@1) - Red dashed line
**Bottom Chart:**
* **X-axis:** k (ranging from 4 to 10, with markers at 4, 5, 6, 7, 8, 9, and 10)
* **Y-axis:** Accuracy (ranging from 25 to 65, with markers at 25, 30, 35, 40, 45, 50, 55, 60, and 65)
* **Legend:**
* Sampling Only (SC@k) - Blue triangles
* SFT Baseline (Pass@1) - Red dashed line
### Detailed Analysis or Content Details
**Top Chart:**
* **SFT Baseline (Pass@1):** Starts at approximately 29.0, increases slightly to 29.2 at # Checkpoints = 2, then decreases to 29.0 at # Checkpoints = 10. The line is relatively flat.
* **Sampling Only (Cumulative):** Starts at approximately 29.0, increases to 30.4 at # Checkpoints = 2, 32.2 at # Checkpoints = 6, and reaches 31.2 at # Checkpoints = 10. The line shows a gradual upward trend.
* **Iterative Learning (Pass@1):** Starts at approximately 29.0, increases sharply to 38.4 at # Checkpoints = 2, 46.7 at # Checkpoints = 4, 49.6 at # Checkpoints = 6, and reaches 57.9 at # Checkpoints = 10. This line exhibits a strong upward trend.
* **Iterative Learning (Cumulative):** Starts at approximately 29.0, increases to 34.9 at # Checkpoints = 2, 42.4 at # Checkpoints = 4, 51.6 at # Checkpoints = 6, and reaches 57.1 at # Checkpoints = 10. This line also shows a consistent upward trend, though slightly less steep than "Iterative Learning (Pass@1)".
**Bottom Chart:**
* **SFT Baseline (Pass@1):** Starts at approximately 30.0, decreases to 29.0 at k = 10. The line is relatively flat.
* **Sampling Only (SC@k):** Starts at approximately 30.0, increases to 31.5 at k = 5, 32.2 at k = 6, 33.3 at k = 7, 34.2 at k = 8, and reaches 35.1 at k = 10. This line shows a gradual upward trend.
### Key Observations
* In the top chart, "Iterative Learning" consistently outperforms both "Sampling Only" and "SFT Baseline" in terms of Pass Rate, especially as the number of checkpoints increases.
* The "SFT Baseline" shows minimal improvement in Pass Rate across all checkpoints.
* In the bottom chart, "Sampling Only" shows a modest increase in Accuracy as 'k' increases, while the "SFT Baseline" remains relatively constant.
* The bottom chart shows a much smaller scale of improvement compared to the top chart.
### Interpretation
The data suggests that "Iterative Learning" is the most effective strategy for improving performance on the math task, as evidenced by the significant increase in Pass Rate with more checkpoints. The "Cumulative" version of Iterative Learning is slightly less effective than the "Pass@1" version, but still outperforms the other methods. "Sampling Only" provides a modest improvement over the "SFT Baseline", but is significantly less effective than "Iterative Learning".
The bottom chart indicates that increasing 'k' in the "Sampling Only" strategy leads to a small improvement in Accuracy, but the overall impact is limited. The consistent performance of the "SFT Baseline" suggests that it may be a less adaptable or effective approach for this particular task.
The difference in scale between the two charts suggests that the number of checkpoints has a more substantial impact on performance than the value of 'k' in the sampling strategy. The charts demonstrate the benefits of iterative refinement and the limitations of a static baseline approach. The data points are relatively smooth, indicating a consistent trend rather than random fluctuations.