## Chart/Diagram Type: Multi-Panel Performance Comparison
### Overview
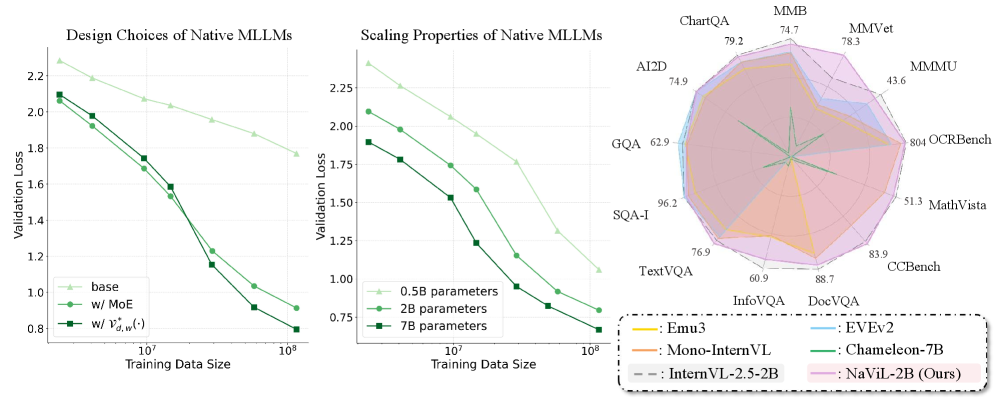
The image presents a multi-panel figure comparing the performance of different Native Multimodal Large Language Models (MLLMs) under varying conditions. The first two panels are line graphs showing validation loss as a function of training data size for different model designs and scaling properties. The third panel is a radar chart comparing the performance of several models across various benchmark datasets.
### Components/Axes
**Panel 1: Design Choices of Native MLLMs**
* **Title:** Design Choices of Native MLLMs
* **X-axis:** Training Data Size (logarithmic scale, markers at 10^7 and 10^8)
* **Y-axis:** Validation Loss (linear scale, from 0.8 to 2.2, increments of 0.2)
* **Legend (bottom-left):**
* Light Green (triangle marker): base
* Green (circle marker): w/ MoE
* Dark Green (square marker): w/ V*d,w(·)
**Panel 2: Scaling Properties of Native MLLMs**
* **Title:** Scaling Properties of Native MLLMs
* **X-axis:** Training Data Size (logarithmic scale, markers at 10^7 and 10^8)
* **Y-axis:** Validation Loss (linear scale, from 0.75 to 2.25, increments of 0.25)
* **Legend (bottom-left):**
* Light Green (triangle marker): 0.5B parameters
* Green (circle marker): 2B parameters
* Dark Green (square marker): 7B parameters
**Panel 3: Radar Chart**
* **Title:** (Implicitly) Performance Comparison on Various Benchmarks
* **Axes (radial):** Represent different benchmark datasets: ChartQA (79.2), AI2D (74.9), MMB (74.7), MMVet (78.3), GQA (62.9), MMMU (43.6), SQA-I (96.2), 804 OCRBench (804), TextVQA (76.9), MathVista (51.3), InfoVQA (60.9), CCBench (83.9), DocVQA (88.7)
* **Legend (bottom-right, in a box with a dashed border):**
* Yellow: Emu3
* Light Blue: EVEv2
* Gray: InternVL-2.5-2B
* Green: Chameleon-7B
* Brown: Mono-InternVL
* Pink: NaViL-2B (Ours)
### Detailed Analysis or ### Content Details
**Panel 1: Design Choices of Native MLLMs**
* **Base (Light Green, triangle):** Validation loss decreases from approximately 2.2 to 1.9 as training data size increases from 10^7 to 10^8.
* At 10^7: ~2.2
* At 10^8: ~1.9
* **w/ MoE (Green, circle):** Validation loss decreases from approximately 2.05 to 0.9 as training data size increases from 10^7 to 10^8.
* At 10^7: ~2.05
* At 10^8: ~0.9
* **w/ V*d,w(·) (Dark Green, square):** Validation loss decreases from approximately 2.05 to 0.85 as training data size increases from 10^7 to 10^8.
* At 10^7: ~2.05
* At 10^8: ~0.85
**Panel 2: Scaling Properties of Native MLLMs**
* **0.5B parameters (Light Green, triangle):** Validation loss decreases from approximately 2.25 to 1.5 as training data size increases from 10^7 to 10^8.
* At 10^7: ~2.25
* At 10^8: ~1.5
* **2B parameters (Green, circle):** Validation loss decreases from approximately 2.0 to 0.9 as training data size increases from 10^7 to 10^8.
* At 10^7: ~2.0
* At 10^8: ~0.9
* **7B parameters (Dark Green, square):** Validation loss decreases from approximately 1.9 to 0.75 as training data size increases from 10^7 to 10^8.
* At 10^7: ~1.9
* At 10^8: ~0.75
**Panel 3: Radar Chart**
* The radar chart visualizes the performance of different models across various benchmark datasets. The values for each benchmark are explicitly labeled on the axes.
* **Emu3 (Yellow):** Appears to perform well on ChartQA (~79), MMB (~75), and DocVQA (~89).
* **EVEv2 (Light Blue):** Shows relatively lower performance across most benchmarks, with a peak at DocVQA (~89).
* **InternVL-2.5-2B (Gray):** Shows relatively lower performance across most benchmarks, with a peak at DocVQA (~89).
* **Chameleon-7B (Green):** Shows relatively lower performance across most benchmarks, with a peak at DocVQA (~89).
* **Mono-InternVL (Brown):** Shows relatively lower performance across most benchmarks, with a peak at DocVQA (~89).
* **NaViL-2B (Ours) (Pink):** Generally outperforms other models across most benchmarks, especially SQA-I (~96), CCBench (~84), and DocVQA (~89).
### Key Observations
* In both line graphs, increasing the training data size leads to a decrease in validation loss, indicating improved model performance.
* The model "w/ V*d,w(·)" and the "7B parameters" model achieve the lowest validation loss at the largest training data size.
* The radar chart shows that NaViL-2B (Ours) generally performs better than other models across the selected benchmarks.
### Interpretation
The data suggests that both the design choices and scaling properties of Native MLLMs significantly impact their performance. Specifically, the "w/ V*d,w(·)" design and larger parameter sizes (7B) lead to lower validation loss, indicating better generalization. The radar chart highlights the strengths and weaknesses of different models across various tasks, with NaViL-2B demonstrating superior overall performance. The consistent decrease in validation loss with increasing training data size underscores the importance of large-scale training for MLLMs.