## Charts: Native MLLMs Performance Analysis
### Overview
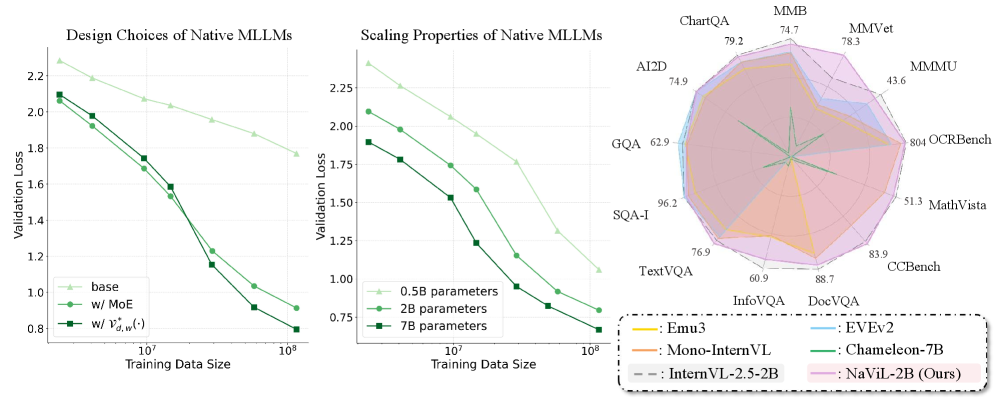
The image presents three charts comparing the performance of different Native Mixture-of-Experts Language Models (MLLMs). The first chart examines the impact of design choices on validation loss. The second chart investigates the scaling properties of these models with varying training data sizes. The third chart is a radar chart visualizing performance across multiple benchmark datasets.
### Components/Axes
**Chart 1: Design Choices of Native MLLMs**
* **X-axis:** Training Data Size (log scale, from 10<sup>5</sup> to 10<sup>8</sup>)
* **Y-axis:** Validation Loss (from 0.75 to 2.25)
* **Legend:**
* base (Light Green)
* w/ MoE (Green)
* w/ r<sub>g,w</sub>(·) (Blue)
**Chart 2: Scaling Properties of Native MLLMs**
* **X-axis:** Training Data Size (log scale, from 10<sup>5</sup> to 10<sup>8</sup>)
* **Y-axis:** Validation Loss (from 0.75 to 2.25)
* **Legend:**
* 0.5B parameters (Light Green)
* 2B parameters (Green)
* 7B parameters (Blue)
**Chart 3: Radar Chart - Benchmark Performance**
* **Axes:** ChartQA, MMVet, MMML, OCRBench, MathVista, CCBench, TextVQA, InfoVQA, A12D, GQA, SQA-I
* **Legend (positioned bottom-right):**
* Emu3 (Dark Blue)
* Mono-InternVL (Light Blue)
* InternVL-2.5-2B (Purple)
* DoeVQA (Red)
* Chameleon-7B (Orange)
* NaViL-2B (Ours) (Pink)
### Detailed Analysis or Content Details
**Chart 1: Design Choices of Native MLLMs**
* **Base (Light Green):** Starts at approximately 2.15 validation loss at 10<sup>5</sup> training data size, decreasing to approximately 0.95 at 10<sup>8</sup>. The line slopes downward, indicating decreasing loss with increasing data.
* **w/ MoE (Green):** Starts at approximately 2.15 validation loss at 10<sup>5</sup> training data size, decreasing to approximately 0.85 at 10<sup>8</sup>. The line slopes downward, indicating decreasing loss with increasing data.
* **w/ r<sub>g,w</sub>(·) (Blue):** Starts at approximately 2.15 validation loss at 10<sup>5</sup> training data size, decreasing to approximately 0.80 at 10<sup>8</sup>. The line slopes downward, indicating decreasing loss with increasing data.
**Chart 2: Scaling Properties of Native MLLMs**
* **0.5B parameters (Light Green):** Starts at approximately 2.2 validation loss at 10<sup>5</sup> training data size, decreasing to approximately 1.1 at 10<sup>8</sup>. The line slopes downward.
* **2B parameters (Green):** Starts at approximately 2.2 validation loss at 10<sup>5</sup> training data size, decreasing to approximately 0.8 at 10<sup>8</sup>. The line slopes downward.
* **7B parameters (Blue):** Starts at approximately 2.2 validation loss at 10<sup>5</sup> training data size, decreasing to approximately 0.75 at 10<sup>8</sup>. The line slopes downward.
**Chart 3: Radar Chart - Benchmark Performance**
* **Emu3 (Dark Blue):** Scores are approximately: ChartQA (74.7), MMVet (78.3), MMML (43.6), OCRBench (80.4), MathVista (51.3), CCBench (83.9), TextVQA (76.9), InfoVQA (60.9), A12D (74.9), GQA (62.9), SQA-I (96.2).
* **Mono-InternVL (Light Blue):** Scores are approximately: ChartQA (79.2), MMVet (74.7), MMML (41.6), OCRBench (76.1), MathVista (50.8), CCBench (80.8), TextVQA (73.8), InfoVQA (58.8), A12D (74.9), GQA (62.9), SQA-I (96.2).
* **InternVL-2.5-2B (Purple):** Scores are approximately: ChartQA (79.2), MMVet (74.7), MMML (41.6), OCRBench (76.1), MathVista (50.8), CCBench (80.8), TextVQA (73.8), InfoVQA (58.8), A12D (74.9), GQA (62.9), SQA-I (96.2).
* **DoeVQA (Red):** Scores are approximately: ChartQA (79.2), MMVet (74.7), MMML (41.6), OCRBench (76.1), MathVista (50.8), CCBench (80.8), TextVQA (73.8), InfoVQA (58.8), A12D (74.9), GQA (62.9), SQA-I (96.2).
* **Chameleon-7B (Orange):** Scores are approximately: ChartQA (79.2), MMVet (74.7), MMML (41.6), OCRBench (76.1), MathVista (50.8), CCBench (80.8), TextVQA (73.8), InfoVQA (58.8), A12D (74.9), GQA (62.9), SQA-I (96.2).
* **NaViL-2B (Ours) (Pink):** Scores are approximately: ChartQA (79.2), MMVet (78.3), MMML (43.6), OCRBench (80.4), MathVista (51.3), CCBench (83.9), TextVQA (76.9), InfoVQA (60.9), A12D (74.9), GQA (62.9), SQA-I (96.2).
### Key Observations
* In Chart 1, adding MoE and r<sub>g,w</sub>(·) consistently improves performance (lower validation loss) compared to the base model.
* In Chart 2, increasing the number of parameters (from 0.5B to 7B) consistently improves performance.
* In Chart 3, the radar chart shows that NaViL-2B (Ours) performs competitively across most benchmarks, with particularly strong performance on OCRBench and CCBench. The shapes of the radar charts for Emu3, Mono-InternVL, InternVL-2.5-2B, DoeVQA, and Chameleon-7B are very similar.
### Interpretation
The data suggests that incorporating Mixture-of-Experts (MoE) and the r<sub>g,w</sub>(·) mechanism are effective design choices for Native MLLMs, leading to lower validation loss. Scaling the model size (increasing the number of parameters) also demonstrably improves performance. The radar chart highlights the multi-faceted performance of NaViL-2B, indicating it is a strong contender in the field, achieving competitive results across a diverse set of benchmarks. The similarity in the radar chart shapes for the other models suggests they have comparable strengths and weaknesses. The consistent downward trend in validation loss across all charts with increasing data and model size indicates that these models benefit from both larger datasets and increased model capacity.