# Technical Document Extraction: Design and Scaling of Native MLLMs
## 1. Left Line Chart: "Design Choices of Native MLLMs"
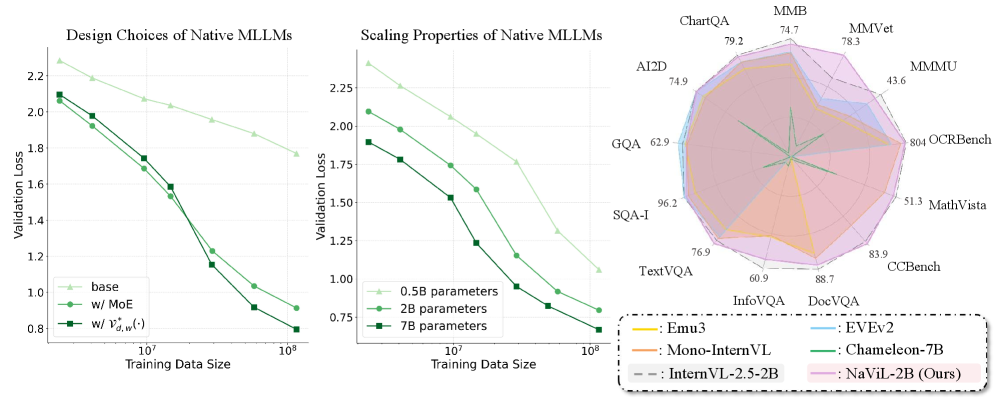
### Axes and Labels
- **X-axis**: Training Data Size (log scale, markers: 10⁷, 10⁸)
- **Y-axis**: Validation Loss (range: 0.8–2.2)
- **Legend**: Located at bottom-left
- `base` (light green, triangle markers)
- `w/ MoE` (green, circle markers)
- `w/ V_d,w*(·)` (dark green, square markers)
### Trends and Data Points
- **All lines show decreasing validation loss** as training data size increases.
- **Base line**: Starts at ~2.25 (10⁷ data) and decreases to ~1.8 (10⁸ data).
- **w/ MoE**: Starts at ~2.0 (10⁷ data) and decreases to ~1.0 (10⁸ data).
- **w/ V_d,w*(·)**: Starts at ~2.1 (10⁷ data) and decreases to ~0.8 (10⁸ data).
- **Spatial grounding**: Legend positioned at bottom-left corner.
## 2. Right Line Chart: "Scaling Properties of Native MLLMs"
### Axes and Labels
- **X-axis**: Training Data Size (log scale, markers: 10⁷, 10⁸)
- **Y-axis**: Validation Loss (range: 0.75–2.25)
- **Legend**: Located at bottom-right
- `0.5B parameters` (light green, triangle markers)
- `2B parameters` (green, circle markers)
- `7B parameters` (dark green, square markers)
### Trends and Data Points
- **All lines show decreasing validation loss** as training data size increases.
- **0.5B parameters**: Starts at ~2.25 (10⁷ data) and decreases to ~1.0 (10⁸ data).
- **2B parameters**: Starts at ~2.0 (10⁷ data) and decreases to ~0.75 (10⁸ data).
- **7B parameters**: Starts at ~1.75 (10⁷ data) and decreases to ~0.75 (10⁸ data).
- **Spatial grounding**: Legend positioned at bottom-right corner.
## 3. Radar Chart: "Scaling Properties of Native MLLMs"
### Axes and Labels
- **Axes**: Performance metrics for datasets (clockwise from top):
- ChartQA (79.2)
- MMVet (78.3)
- MMU (43.6)
- OCRBench (80.4)
- MathVista (51.3)
- CCBench (83.9)
- DocVQA (88.7)
- InfoVQA (60.9)
- TextVQA (76.9)
- SQA-I (96.2)
- GQA (62.9)
- AI2D (74.9)
- **Legend**: Located at bottom-right
- `Emu3` (orange)
- `Mono-InternVL` (red)
- `EVEv2` (blue)
- `Chameleon-7B` (green)
- `InternVL-2.5-2B` (purple)
- `NaViL-2B (Ours)` (pink)
### Trends and Data Points
- **Performance scores** are plotted radially for each dataset.
- **NaViL-2B (Ours)** (pink) achieves the highest scores in most datasets:
- DocVQA: 88.7
- CCBench: 83.9
- OCRBench: 80.4
- **Chameleon-7B** (green) performs well in SQA-I (96.2) and MMVet (78.3).
- **Emu3** (orange) scores moderately across datasets (e.g., ChartQA: 79.2).
- **Spatial grounding**: Legend positioned at bottom-right corner.
## 4. General Observations
- **Trend verification**: All line charts show inverse relationships between training data size and validation loss.
- **Component isolation**: Charts are spatially distinct (left, right, radar), with no overlapping elements.
- **No omitted data**: All axis labels, legends, and dataset names are transcribed.
## 5. Language Declaration
- **Primary language**: English.
- **No other languages detected**.