## Heatmap: Performance vs. Number of Feedback Repairs and Initial Programs
### Overview
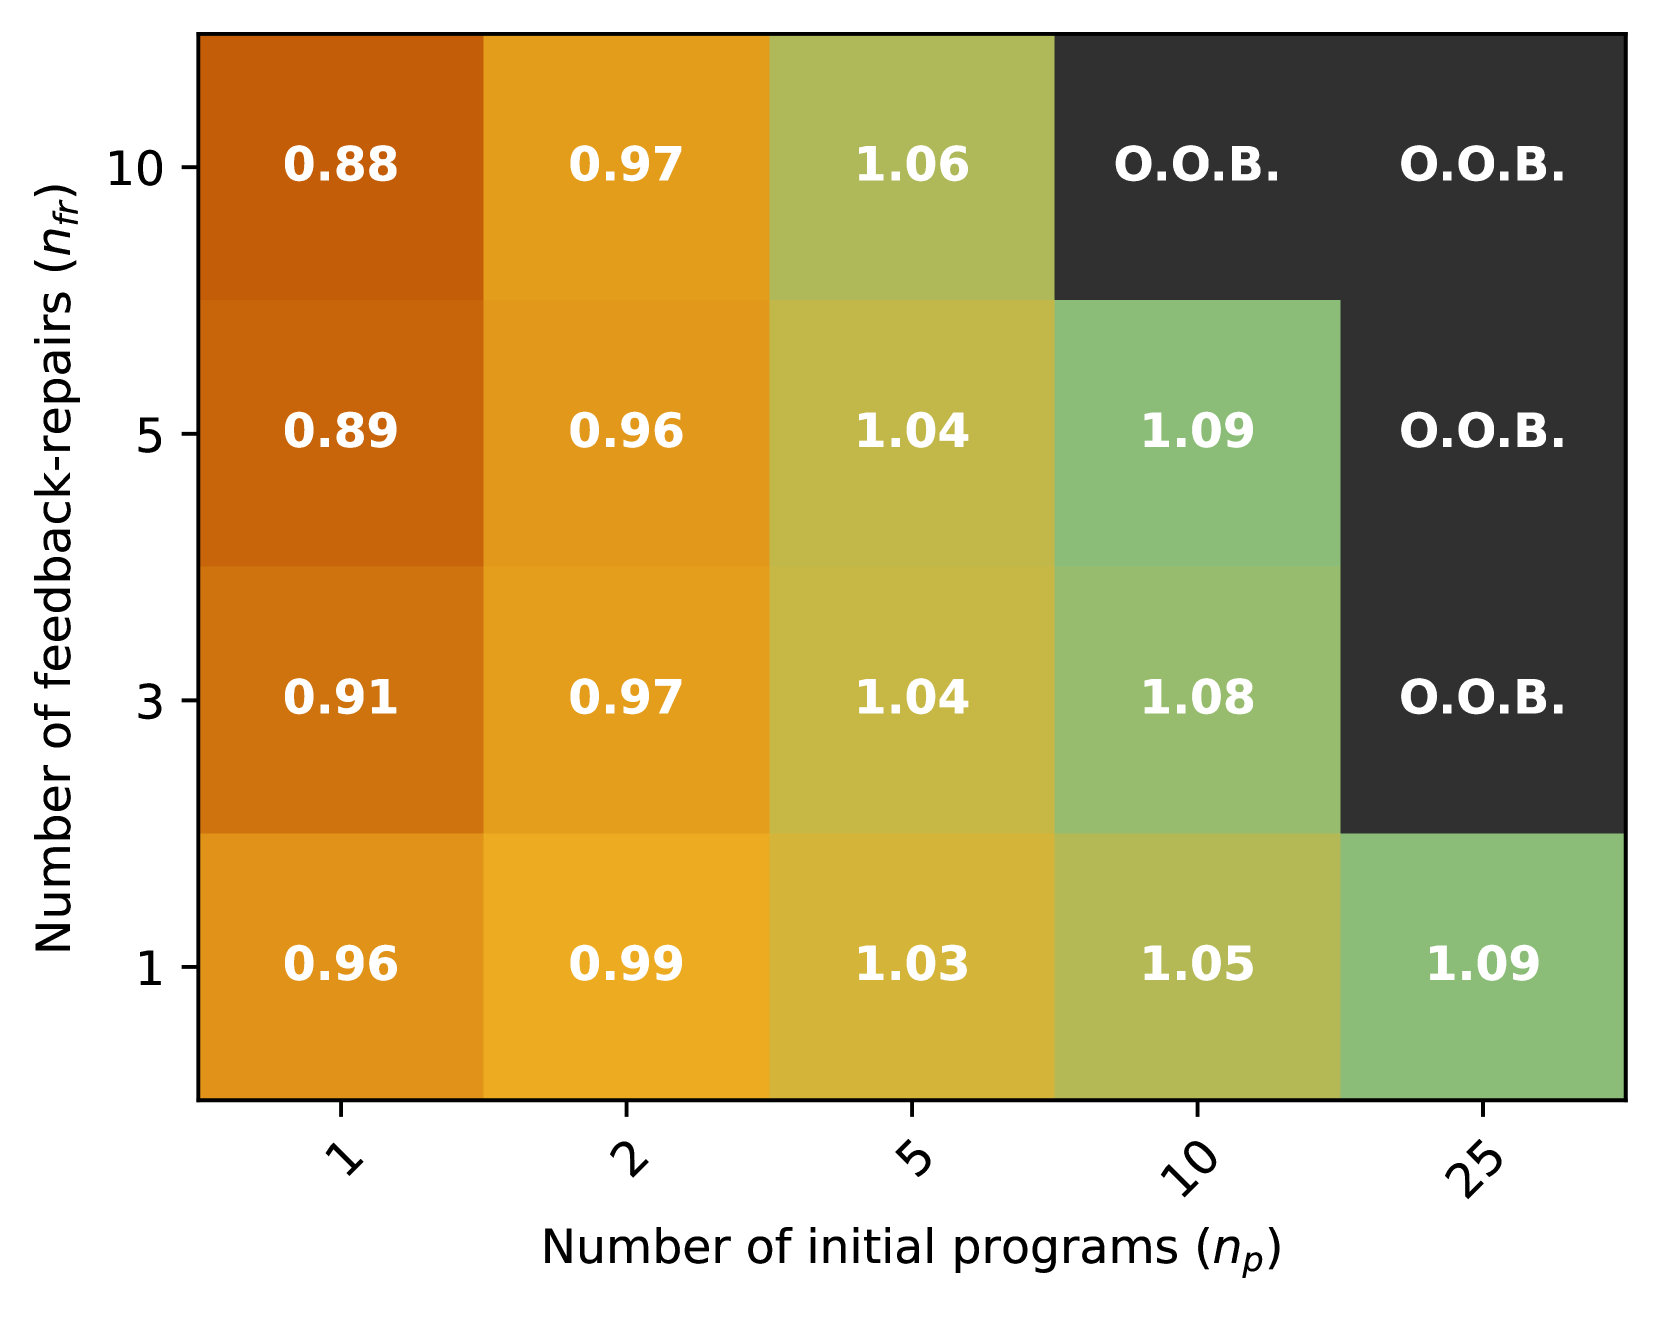
The image is a heatmap visualizing performance (represented by color intensity) as a function of two variables: the number of feedback repairs (nfr) and the number of initial programs (np). The heatmap displays numerical values within each cell, and some cells are marked "O.O.B." (likely indicating "Out Of Bounds").
### Components/Axes
* **X-axis (Horizontal):** Number of initial programs (np). Values: 1, 2, 5, 10, 25.
* **Y-axis (Vertical):** Number of feedback-repairs (nfr). Values: 1, 3, 5, 10.
* **Color Gradient:** The color gradient represents performance, with darker orange indicating lower values, transitioning to yellow, then green for higher values, and finally black for "O.O.B.".
* **Cells:** Each cell contains a numerical value or the label "O.O.B.".
### Detailed Analysis or Content Details
The heatmap contains the following data points:
* **nfr = 10:**
* np = 1: 0.88 (dark orange)
* np = 2: 0.97 (orange)
* np = 5: 1.06 (yellow-green)
* np = 10: O.O.B. (black)
* np = 25: O.O.B. (black)
* **nfr = 5:**
* np = 1: 0.89 (dark orange)
* np = 2: 0.96 (orange)
* np = 5: 1.04 (yellow-green)
* np = 10: 1.09 (green)
* np = 25: O.O.B. (black)
* **nfr = 3:**
* np = 1: 0.91 (orange)
* np = 2: 0.97 (orange)
* np = 5: 1.04 (yellow-green)
* np = 10: 1.08 (green)
* np = 25: O.O.B. (black)
* **nfr = 1:**
* np = 1: 0.96 (orange)
* np = 2: 0.99 (yellow)
* np = 5: 1.03 (yellow)
* np = 10: 1.05 (yellow-green)
* np = 25: 1.09 (green)
### Key Observations
* **Trend:** Generally, performance increases as the number of initial programs (np) increases, up to a point.
* **O.O.B.:** For higher numbers of feedback repairs (nfr = 5 and 10), the system goes "Out Of Bounds" (O.O.B.) when the number of initial programs (np) is high (10 and 25).
* **Optimal Region:** The best performance (highest values) seems to be achieved with a moderate number of feedback repairs (nfr = 1, 3, 5) and a moderate number of initial programs (np = 5, 10, 25).
* **Lower Performance:** Lower performance (lower values) is observed with a low number of initial programs (np = 1, 2) regardless of the number of feedback repairs.
### Interpretation
The heatmap suggests that there is an optimal combination of feedback repairs and initial programs for achieving the best performance. Increasing the number of initial programs generally improves performance, but only up to a certain point. Beyond that point, especially with a high number of feedback repairs, the system may become unstable or "Out Of Bounds." The data indicates that a balance between exploration (initial programs) and refinement (feedback repairs) is crucial. The "O.O.B." values suggest a limitation or constraint in the system being analyzed, where certain combinations of parameters lead to failure or undefined behavior.