## Heatmap: Feedback-Repairs vs. Initial Programs
### Overview
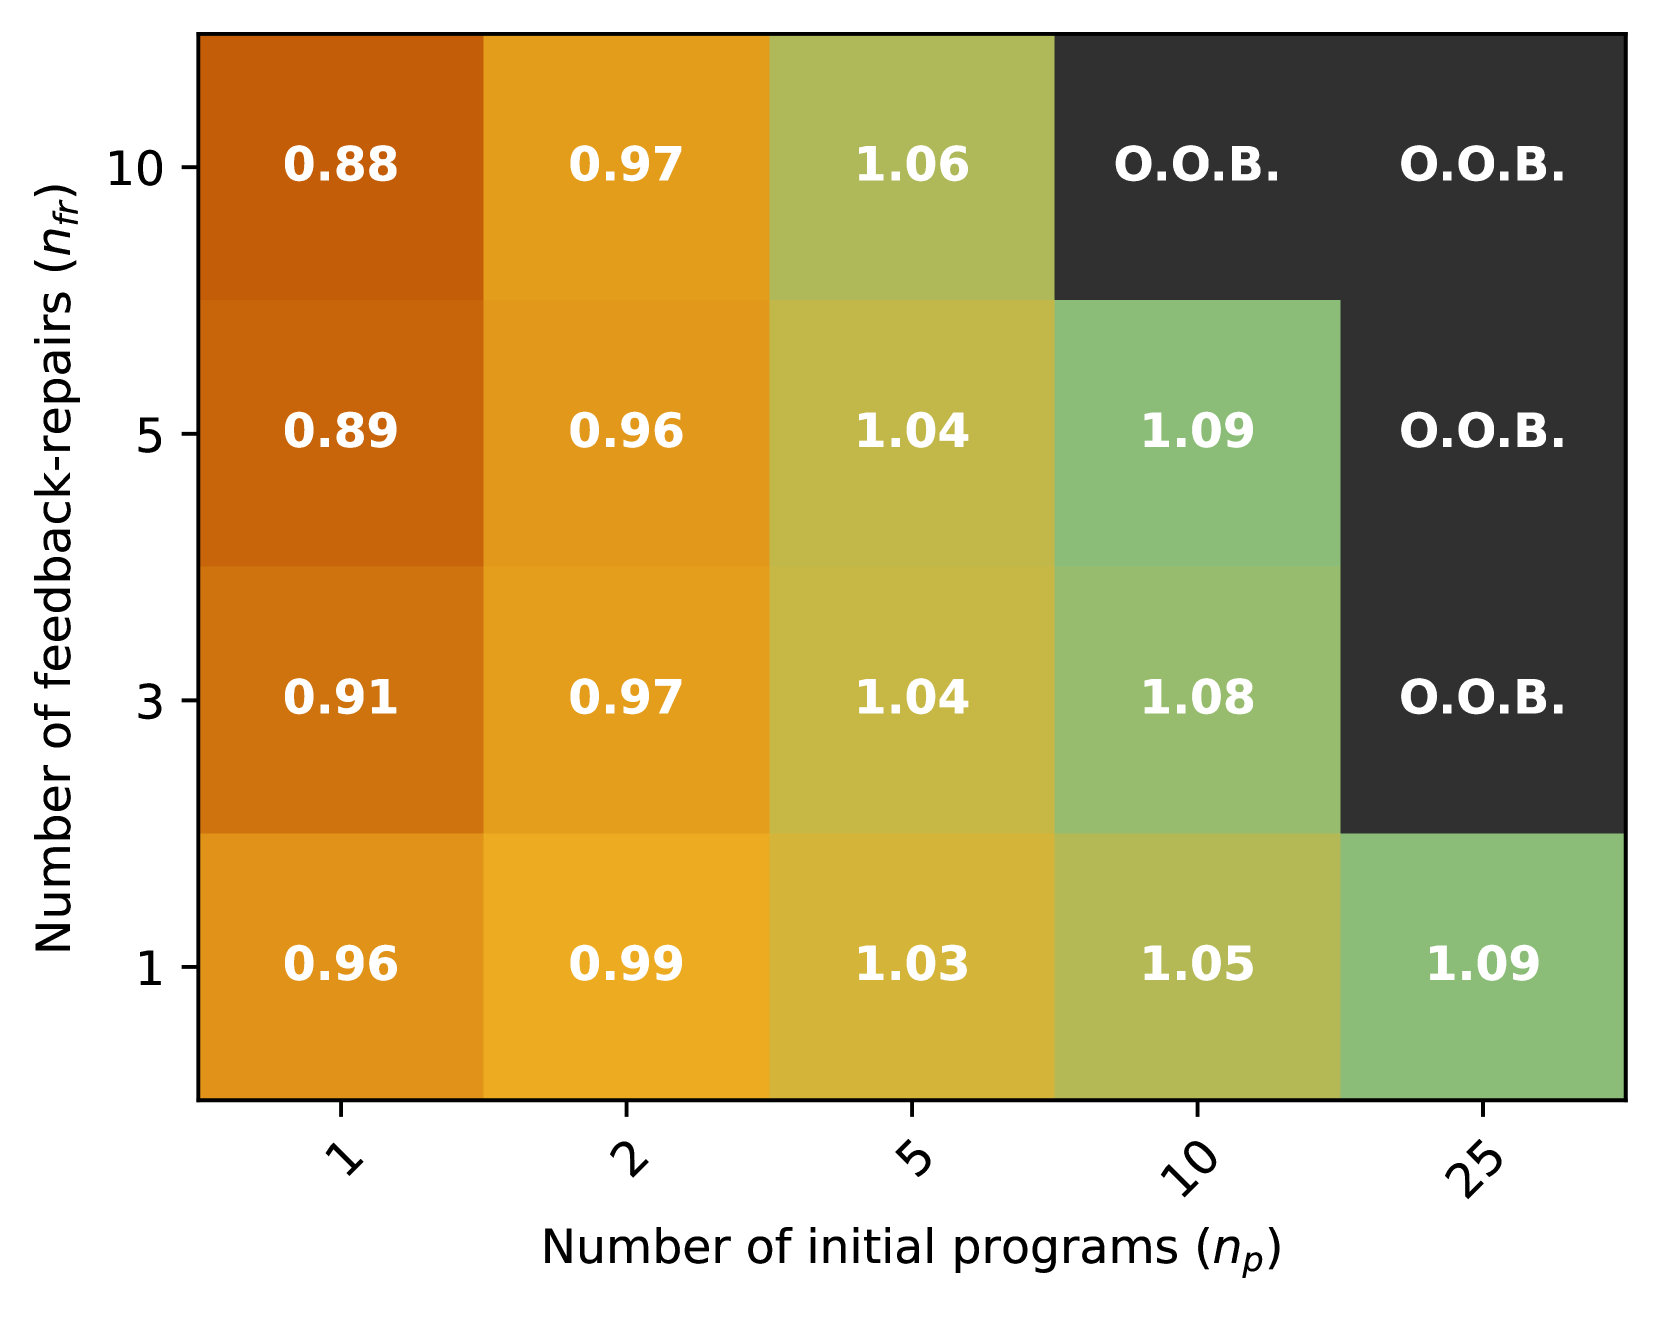
This image presents a heatmap visualizing the relationship between the number of initial programs (n<sub>p</sub>) and the number of feedback-repairs (n<sub>f</sub>). The heatmap uses a color gradient to represent numerical values, ranging from orange to dark green. Several cells contain the abbreviation "O.O.B."
### Components/Axes
* **X-axis:** Number of initial programs (n<sub>p</sub>) with markers at 1, 2, 5, 10, and 25.
* **Y-axis:** Number of feedback-repairs (n<sub>f</sub>) with markers at 1, 3, 5, and 10.
* **Color Scale:** A gradient from orange (lower values) to dark green (higher values).
* **Data Labels:** Numerical values are displayed within each cell of the heatmap.
* **"O.O.B." Labels:** Some cells are labeled "O.O.B."
### Detailed Analysis
The heatmap displays the following values:
* **n<sub>p</sub> = 1:**
* n<sub>f</sub> = 1: 0.96
* n<sub>f</sub> = 3: 0.91
* n<sub>f</sub> = 5: 0.89
* n<sub>f</sub> = 10: 0.88
* **n<sub>p</sub> = 2:**
* n<sub>f</sub> = 1: 0.99
* n<sub>f</sub> = 3: 0.97
* n<sub>f</sub> = 5: 0.96
* n<sub>f</sub> = 10: 0.97
* **n<sub>p</sub> = 5:**
* n<sub>f</sub> = 1: 1.03
* n<sub>f</sub> = 3: 1.04
* n<sub>f</sub> = 5: 1.04
* n<sub>f</sub> = 10: 1.06
* **n<sub>p</sub> = 10:**
* n<sub>f</sub> = 1: 1.05
* n<sub>f</sub> = 3: 1.08
* n<sub>f</sub> = 5: 1.09
* n<sub>f</sub> = 10: O.O.B.
* **n<sub>p</sub> = 25:**
* n<sub>f</sub> = 1: 1.09
* n<sub>f</sub> = 3: O.O.B.
* n<sub>f</sub> = 5: O.O.B.
* n<sub>f</sub> = 10: O.O.B.
The values generally increase as both n<sub>p</sub> and n<sub>f</sub> increase, but this trend is not consistent across all cells. The cells labeled "O.O.B." indicate that the corresponding data point is "Out Of Bounds" or invalid.
### Key Observations
* The values are clustered between 0.88 and 1.09, with a few "O.O.B." values.
* The highest values (around 1.09) occur when either n<sub>p</sub> or n<sub>f</sub> is relatively high.
* The "O.O.B." values appear in the top-right corner of the heatmap, suggesting that the relationship between n<sub>p</sub> and n<sub>f</sub> breaks down for larger values of both variables.
* There is a clear gradient from orange to green, indicating a positive correlation between the two variables, but with limitations.
### Interpretation
The heatmap likely represents the results of an experiment or simulation investigating the effectiveness of feedback-repair mechanisms in relation to the number of initial programs. The values within the heatmap could represent a metric such as success rate, efficiency, or performance.
The increasing values as both n<sub>p</sub> and n<sub>f</sub> increase suggest that more initial programs and more feedback-repair iterations generally lead to better outcomes, up to a certain point. However, the "O.O.B." values indicate that this relationship is not sustainable indefinitely. It's possible that beyond a certain number of initial programs or feedback-repair iterations, the system becomes unstable or the benefits of further iterations diminish.
The "O.O.B." designation suggests a boundary or constraint within the system being modeled. This could be due to computational limitations, algorithmic constraints, or inherent properties of the problem being solved. The data suggests that the model or experiment is not valid for the combinations of n<sub>p</sub> and n<sub>f</sub> that result in "O.O.B." values.