## Heatmap: Performance Metric vs. Initial Programs and Feedback-Repairs
### Overview
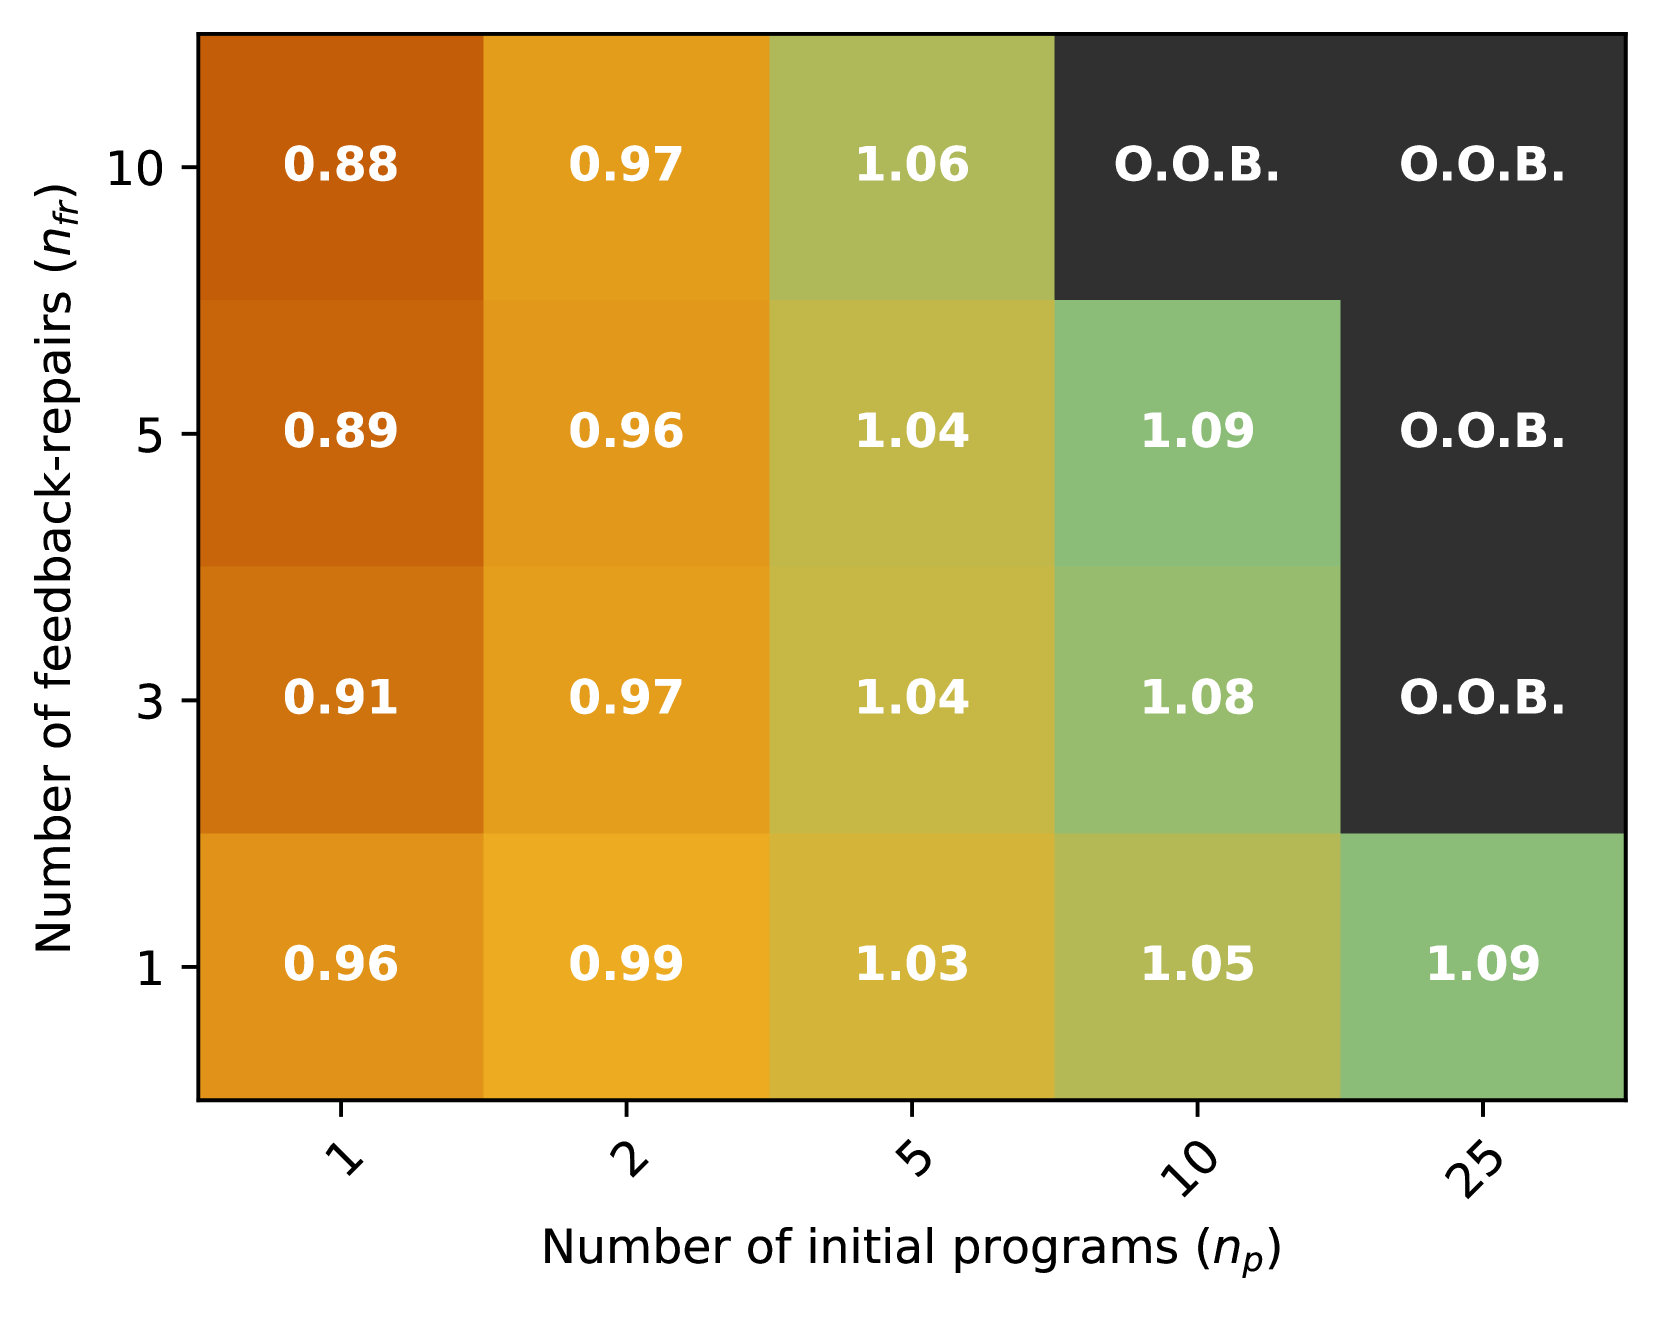
The image is a heatmap displaying a numerical performance metric (values ranging from 0.88 to 1.09) across a grid defined by two parameters: the "Number of initial programs (n_p)" on the x-axis and the "Number of feedback-repairs (n_fr)" on the y-axis. Cells where the metric could not be computed or is invalid are labeled "O.O.B." (likely "Out Of Bounds"). The color of each cell corresponds to its numerical value, following a gradient from dark orange (lowest values) through yellow and light green to dark green (highest values). Cells labeled "O.O.B." are colored black.
### Components/Axes
* **X-Axis (Horizontal):** Labeled "Number of initial programs (n_p)". The axis has five discrete, non-linearly spaced tick marks at values: **1, 2, 5, 10, 25**.
* **Y-Axis (Vertical):** Labeled "Number of feedback-repairs (n_fr)". The axis has four discrete tick marks at values: **1, 3, 5, 10**.
* **Data Grid:** A 4-row by 5-column grid. Each cell contains a centered, white-text numerical value or the label "O.O.B.".
* **Color Legend (Implicit):** There is no separate legend box. The color scale is embedded in the data cells themselves, mapping value to color:
* **Dark Orange:** ~0.88 - 0.91
* **Orange/Yellow:** ~0.96 - 0.99
* **Yellow-Green:** ~1.03 - 1.06
* **Light Green:** ~1.08 - 1.09
* **Black:** "O.O.B."
### Detailed Analysis
The following table reconstructs the heatmap's data, with rows corresponding to `n_fr` (y-axis, from bottom to top) and columns to `n_p` (x-axis, from left to right).
| n_fr \ n_p | **1** | **2** | **5** | **10** | **25** |
| :--- | :--- | :--- | :--- | :--- | :--- |
| **10** | 0.88 | 0.97 | 1.06 | O.O.B. | O.O.B. |
| **5** | 0.89 | 0.96 | 1.04 | 1.09 | O.O.B. |
| **3** | 0.91 | 0.97 | 1.04 | 1.08 | O.O.B. |
| **1** | 0.96 | 0.99 | 1.03 | 1.05 | 1.09 |
**Trend Verification:**
* **Horizontal Trend (Fixed n_fr):** For a fixed number of feedback-repairs, the metric generally **increases** as the number of initial programs (`n_p`) increases. This is visually represented by the color shifting from orange towards green as you move right along any row. The trend is consistent until the "O.O.B." region is reached.
* **Vertical Trend (Fixed n_p):** For a fixed number of initial programs, the relationship with feedback-repairs (`n_fr`) is less uniform.
* At `n_p = 1`, the value **decreases** slightly as `n_fr` increases (0.96 -> 0.91 -> 0.89 -> 0.88).
* At `n_p = 2` and `n_p = 5`, the values are relatively stable across different `n_fr`.
* At `n_p = 10`, the value **increases** as `n_fr` decreases (1.09 at n_fr=5 vs. 1.05 at n_fr=1).
### Key Observations
1. **Performance Ceiling & O.O.B. Zone:** The highest recorded metric value is **1.09**, achieved at two points: (`n_p=10, n_fr=5`) and (`n_p=25, n_fr=1`). A clear "Out Of Bounds" (O.O.B.) region exists in the top-right corner of the heatmap, corresponding to high values of both parameters (`n_p >=10` with `n_fr >=10`, and `n_p=25` with `n_fr >=3`).
2. **Optimal Region:** The highest performance (values >= 1.08) is found in a cluster around `n_p=10` and `n_p=25` with lower `n_fr` values (1 and 5).
3. **Lowest Performance:** The lowest metric value (**0.88**) occurs at the combination of the fewest initial programs (`n_p=1`) and the most feedback-repairs (`n_fr=10`).
4. **Color-Value Correlation:** The color gradient is consistent. Dark orange cells contain the lowest values (0.88-0.91), yellow-green cells contain mid-range values (1.03-1.06), and light green cells contain the highest valid values (1.08-1.09).
### Interpretation
This heatmap likely visualizes the performance (e.g., success rate, efficiency score, or quality metric) of a program repair or synthesis system that uses an initial set of programs (`n_p`) and a feedback-driven repair loop (`n_fr`). The data suggests several key insights:
* **More Initial Programs Generally Help:** Increasing the initial pool of candidate programs (`n_p`) tends to improve the final outcome, as seen by the rightward increase in values across rows.
* **Feedback Repairs Have Diminishing/Complex Returns:** The role of feedback repairs (`n_fr`) is nuanced. While some repair iterations are beneficial (e.g., moving from `n_fr=1` to `n_fr=5` at `n_p=10` improves the score from 1.05 to 1.09), excessive repairs combined with a large initial pool (`n_p=25, n_fr>=3`) lead to failure (O.O.B.). This could indicate system instability, overfitting, or resource exhaustion under high computational load.
* **Trade-off and System Limits:** The "O.O.B." zone defines the operational limits of the system. The most robust high-performance configuration appears to be a moderate-to-large initial program set (`n_p=10`) with a moderate number of repair cycles (`n_fr=5`). Pushing both parameters to their maximum (`n_p=25, n_fr=10`) is not viable.
* **The "Less is More" Anomaly:** At the smallest initial pool (`n_p=1`), adding more feedback repairs actually *degrades* performance. This could imply that with very few starting options, aggressive repair attempts are counterproductive, perhaps by corrupting the only viable candidate.
In summary, the chart demonstrates a non-linear interaction between initial diversity (`n_p`) and iterative refinement (`n_fr`). Optimal performance requires balancing these two factors, as maximizing both leads to system failure. The sweet spot lies in providing sufficient initial candidates while applying a controlled, not maximal, amount of repair effort.