## Heatmap: Relationship Between Feedback-Repairs and Initial Programs
### Overview
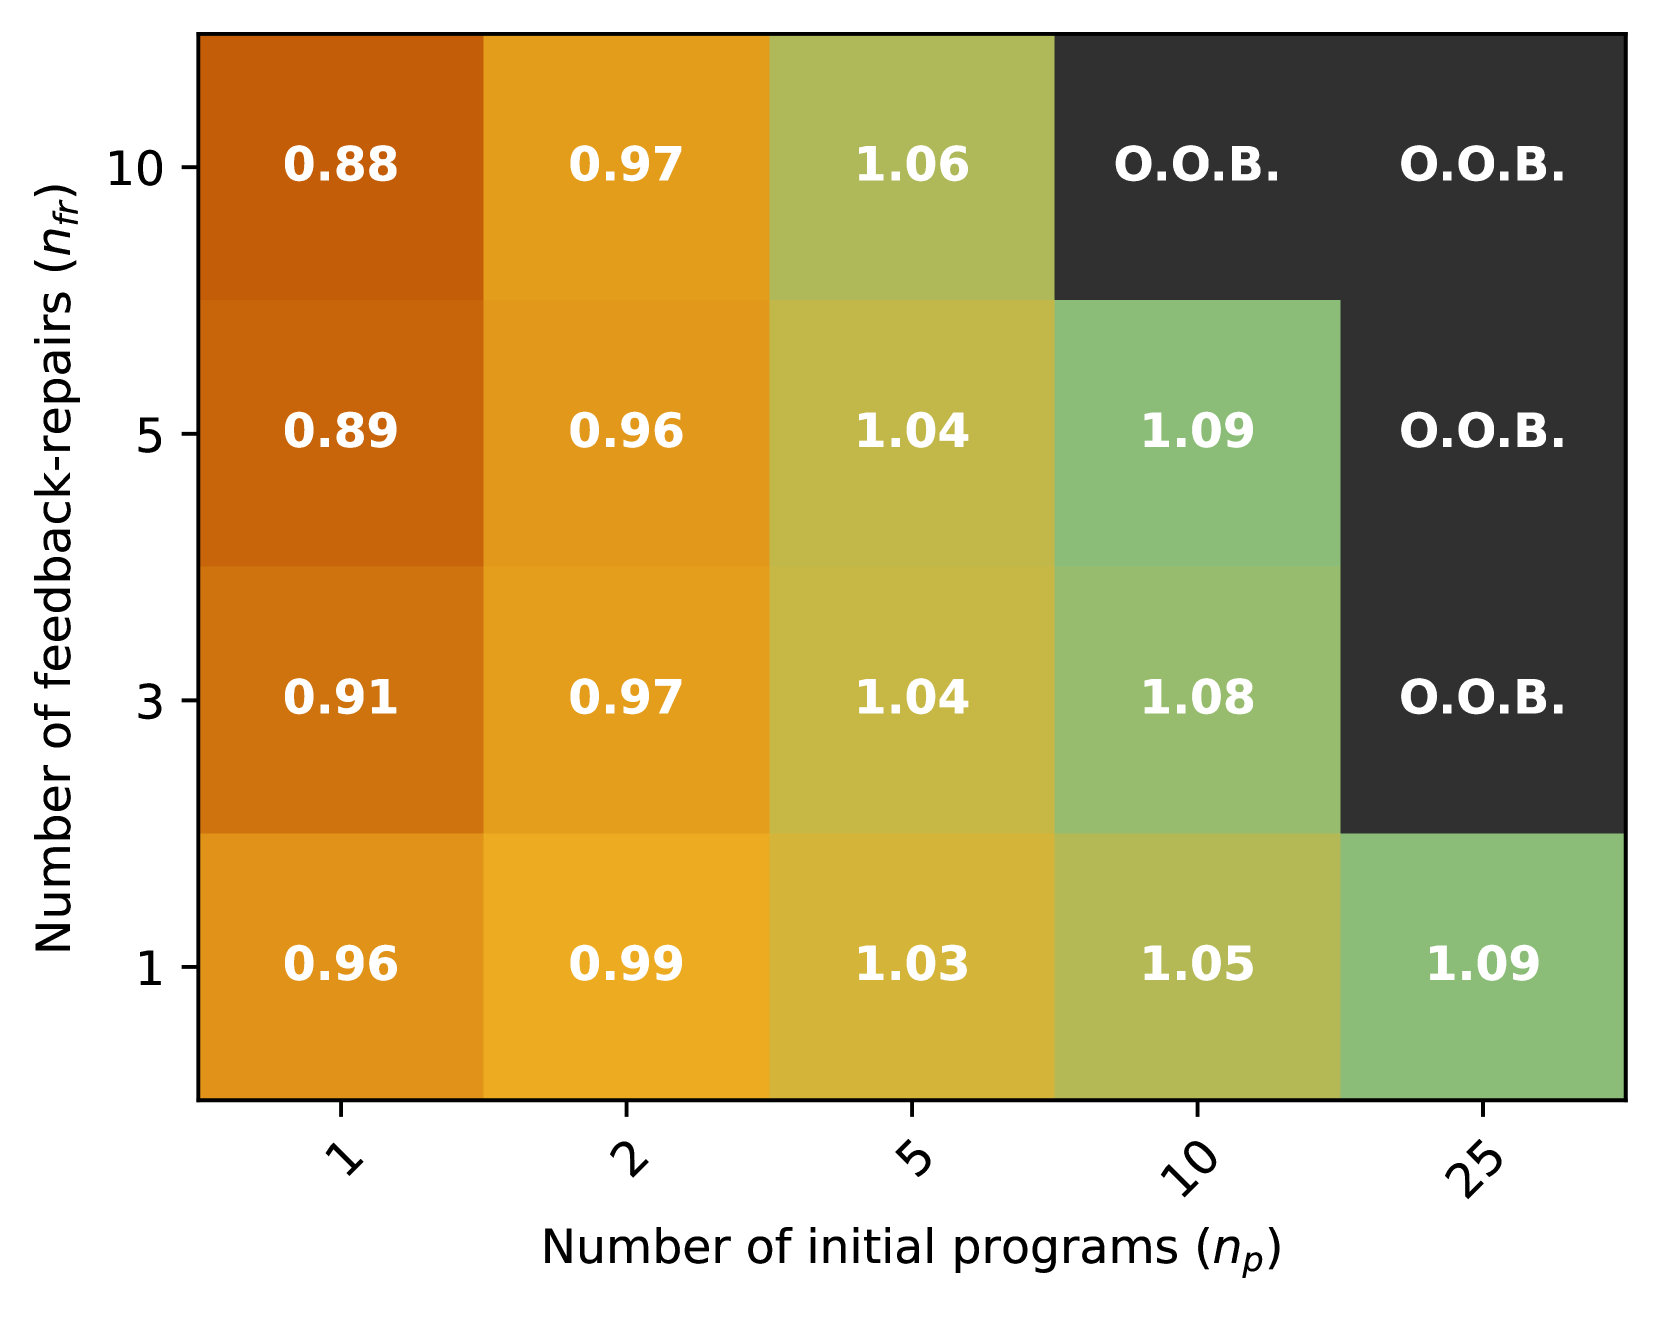
The image is a heatmap visualizing the relationship between the number of feedback-repairs (`n_fr`) and the number of initial programs (`n_p`). Values are represented numerically in cells, with color gradients transitioning from orange (low values) to green (mid values) to black (high values). The top-right corner contains "O.O.B." (likely "Out of Bounds") annotations.
---
### Components/Axes
- **Y-Axis (Vertical)**:
- Label: "Number of feedback-repairs (`n_fr`)"
- Categories: 1, 3, 5, 10 (increasing downward)
- **X-Axis (Horizontal)**:
- Label: "Number of initial programs (`n_p`)"
- Categories: 1, 2, 5, 10, 25 (increasing rightward)
- **Color Gradient**:
- Orange → Green → Black (increasing value intensity)
- No explicit legend, but color correlates with numerical values.
---
### Detailed Analysis
#### Data Table Reconstruction
| `n_fr` \ `n_p` | 1 | 2 | 5 | 10 | 25 |
|----------------|-------|-------|-------|-------|-------|
| 1 | 0.96 | 0.99 | 1.03 | 1.05 | 1.09 |
| 3 | 0.91 | 0.97 | 1.04 | 1.08 | O.O.B.|
| 5 | 0.89 | 0.96 | 1.04 | 1.09 | O.O.B.|
| 10 | 0.88 | 0.97 | 1.06 | O.O.B.| O.O.B.|
#### Key Observations
1. **Trend**:
- Values generally increase with higher `n_p` and `n_fr`, peaking at `n_p = 25` and `n_fr = 1` (1.09).
- "O.O.B." annotations appear exclusively in the top-right quadrant (`n_p ≥ 10`, `n_fr ≥ 3`), suggesting a threshold beyond which values become undefined or invalid.
2. **Color Consistency**:
- Orange cells (e.g., 0.88–0.99) dominate the bottom-left.
- Green cells (1.03–1.09) occupy the mid-range.
- Black cells (O.O.B.) are confined to the extreme top-right.
---
### Interpretation
- **Relationship**:
The heatmap suggests a positive correlation between `n_p` and `n_fr` up to a critical threshold. Beyond `n_p = 10` and `n_fr ≥ 3`, the system transitions to "O.O.B.", implying diminishing returns or operational failure.
- **Anomalies**:
The value at `n_fr = 10`, `n_p = 1` (0.88) is the lowest, contradicting the general upward trend. This may indicate inefficiency at high feedback-repair rates with minimal initial programs.
- **Practical Implications**:
Balancing `n_p` and `n_fr` is critical. Exceeding thresholds risks system instability, as reflected by "O.O.B." entries.
---
### Spatial Grounding & Verification
- **Legend**: Implied via color gradient (no explicit legend).
- **Trend Verification**:
- For `n_fr = 1`, values rise monotonically with `n_p` (0.96 → 1.09).
- For `n_p = 25`, values drop to "O.O.B." as `n_fr` increases, confirming threshold behavior.
- **Component Isolation**:
- Header: Axis labels and categories.
- Main Chart: Heatmap cells with numerical/color data.
- Footer: "O.O.B." annotations.
---
### Final Notes
The heatmap highlights a trade-off between scaling initial programs and feedback-repairs. Values beyond the "O.O.B." threshold likely represent unsustainable or erroneous states, requiring further investigation into system constraints.