TECHNICAL ASSET FINGERPRINT
ea95236c793f060108d6615c
Click to view fullscreen
Press ESC or click to close
FOUND IN PAPERS
EXPERT: gemini-2.5-flash-lite-free VERSION 1
RUNTIME: google-free/gemini-2.5-flash-lite
INTEL_VERIFIED
## Line Chart and Bar Chart: Behavioral Cloning Analysis
### Overview
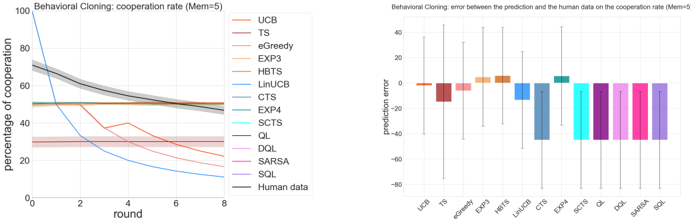
The image contains two plots side-by-side, both related to "Behavioral Cloning" with a parameter "Mem=5". The left plot is a line chart showing the "percentage of cooperation" over "round" for various algorithms and "Human data". The right plot is a bar chart displaying "prediction error" for different algorithms, with error bars indicating uncertainty.
### Components/Axes
**Left Chart: Line Chart**
* **Title:** Behavioral Cloning: cooperation rate (Mem=5)
* **Y-axis Title:** percentage of cooperation
* **Y-axis Scale:** 0 to 100, with major ticks at 0, 20, 40, 60, 80, 100.
* **X-axis Title:** round
* **X-axis Scale:** 0 to 8, with major ticks at 0, 2, 4, 6, 8.
* **Legend:** Located in the top-right quadrant of the chart. It lists the following algorithms and data series, each associated with a distinct color:
* UCB (light red line)
* TS (red line)
* eGreedy (orange line)
* EXP3 (brown line)
* HBTS (dark brown line)
* LinUCB (light blue line)
* CTS (cyan line)
* EXP4 (teal line)
* SCTS (light cyan line)
* QL (purple line)
* DQL (magenta line)
* SARSA (pink line)
* SQL (light purple line)
* Human data (dark grey line)
* **Shaded Areas:** Each line has a shaded area around it, likely representing confidence intervals or variance.
**Right Chart: Bar Chart**
* **Title:** Behavioral Cloning: error between the prediction and the human data on the cooperation rate (Mem=5)
* **Y-axis Title:** prediction error
* **Y-axis Scale:** -80 to 40, with major ticks at -80, -60, -40, -20, 0, 20, 40.
* **X-axis Labels:** The x-axis displays the names of various algorithms: UCB, TS, eGreedy, EXP3, HBTS, LinUCB, CTS, EXP4, SCTS, QL, DQL, SARSA, SQL. These labels are positioned below the bars.
* **Bars:** Each bar represents the prediction error for a specific algorithm. The color of each bar corresponds to the color of the respective line in the legend of the left chart.
* **Error Bars:** Vertical lines extend from the top of each bar, indicating the range of uncertainty or standard deviation for the prediction error.
### Detailed Analysis or Content Details
**Left Chart: Line Chart**
* **UCB (light red):** Starts at approximately 30% cooperation at round 0 and sharply decreases to around 15% by round 8. The shaded area suggests significant initial uncertainty.
* **TS (red):** Starts at approximately 50% cooperation at round 0 and decreases to around 30% by round 8.
* **eGreedy (orange):** Starts at approximately 50% cooperation at round 0 and remains relatively stable around 50% throughout the rounds, with a slight dip and recovery.
* **EXP3 (brown):** Starts at approximately 50% cooperation at round 0 and remains relatively stable around 50% throughout the rounds.
* **HBTS (dark brown):** Starts at approximately 50% cooperation at round 0 and remains relatively stable around 50% throughout the rounds.
* **LinUCB (light blue):** Starts at approximately 100% cooperation at round 0 and sharply decreases to around 10% by round 8.
* **CTS (cyan):** Starts at approximately 50% cooperation at round 0 and remains relatively stable around 50% throughout the rounds.
* **EXP4 (teal):** Starts at approximately 50% cooperation at round 0 and remains relatively stable around 50% throughout the rounds.
* **SCTS (light cyan):** Starts at approximately 50% cooperation at round 0 and remains relatively stable around 50% throughout the rounds.
* **QL (purple):** Starts at approximately 50% cooperation at round 0 and remains relatively stable around 50% throughout the rounds.
* **DQL (magenta):** Starts at approximately 50% cooperation at round 0 and remains relatively stable around 50% throughout the rounds.
* **SARSA (pink):** Starts at approximately 50% cooperation at round 0 and remains relatively stable around 50% throughout the rounds.
* **SQL (light purple):** Starts at approximately 50% cooperation at round 0 and remains relatively stable around 50% throughout the rounds.
* **Human data (dark grey):** Starts at approximately 70% cooperation at round 0 and gradually decreases to around 50% by round 8.
**Right Chart: Bar Chart**
* **UCB (light red):** Prediction error is approximately 0, with error bars extending from roughly -40 to +20.
* **TS (red):** Prediction error is approximately -10, with error bars extending from roughly -40 to +10.
* **eGreedy (orange):** Prediction error is approximately -5, with error bars extending from roughly -10 to +10.
* **EXP3 (brown):** Prediction error is approximately +5, with error bars extending from roughly -10 to +20.
* **HBTS (dark brown):** Prediction error is approximately +5, with error bars extending from roughly -10 to +20.
* **LinUCB (light blue):** Prediction error is approximately -10, with error bars extending from roughly -40 to +10.
* **CTS (cyan):** Prediction error is approximately -15, with error bars extending from roughly -40 to +10.
* **EXP4 (teal):** Prediction error is approximately -10, with error bars extending from roughly -20 to +10.
* **SCTS (light cyan):** Prediction error is approximately -10, with error bars extending from roughly -20 to +10.
* **QL (purple):** Prediction error is approximately -10, with error bars extending from roughly -20 to +10.
* **DQL (magenta):** Prediction error is approximately -10, with error bars extending from roughly -20 to +10.
* **SARSA (pink):** Prediction error is approximately -10, with error bars extending from roughly -20 to +10.
* **SQL (light purple):** Prediction error is approximately -10, with error bars extending from roughly -20 to +10.
### Key Observations
* **Divergent Cooperation Rates:** The left chart clearly shows that most algorithms (except LinUCB and UCB) converge to a cooperation rate around 50%, similar to the stable cooperation rate of "Human data" after initial rounds. LinUCB and UCB exhibit drastically different, declining cooperation rates.
* **Prediction Accuracy:** The right chart indicates that most algorithms have a prediction error around -10, meaning their predicted cooperation rate is generally lower than the human data. UCB, EXP3, and HBTS show prediction errors closer to 0 or slightly positive.
* **High Uncertainty for Some Algorithms:** UCB, TS, LinUCB, and CTS exhibit large error bars in the prediction error chart, suggesting higher variability or uncertainty in their predictions compared to other algorithms.
* **LinUCB and UCB Anomalies:** LinUCB's extremely high initial cooperation rate and subsequent sharp decline, along with UCB's similar sharp decline, are notable outliers in the cooperation rate chart. Their prediction errors are also relatively high in magnitude compared to the majority of other algorithms.
### Interpretation
The two plots together provide insights into the performance of various "Behavioral Cloning" algorithms in mimicking human cooperation behavior.
The **left chart** demonstrates how different algorithms learn to cooperate over "rounds". The "Human data" serves as a benchmark, showing a gradual decrease in cooperation from an initial high to a stable level around 50%. Most of the tested algorithms (eGreedy, EXP3, HBTS, LinUCB, CTS, EXP4, SCTS, QL, DQL, SARSA, SQL) appear to converge towards this 50% cooperation rate, suggesting they are learning to approximate human behavior in this regard. However, **LinUCB** and **UCB** stand out as anomalies. LinUCB starts at near-perfect cooperation and rapidly deteriorates, while UCB also shows a significant decline. This suggests these algorithms might be employing strategies that are not conducive to sustained cooperation in this context.
The **right chart** quantifies how well these algorithms' predictions align with the actual "human data" on cooperation rate. A prediction error close to zero would indicate good predictive accuracy. Most algorithms show a negative prediction error, meaning they tend to predict a lower cooperation rate than observed in human data. This could imply that the algorithms are generally more conservative or less cooperative in their predictions than humans. Algorithms like UCB, EXP3, and HBTS have prediction errors closer to zero, suggesting they are better at predicting the human cooperation rate, although their cooperation trajectories in the left chart are not necessarily superior (UCB's is poor). The large error bars for UCB, TS, LinUCB, and CTS indicate that their predictions are less consistent or more variable, making them less reliable predictors of human behavior.
In essence, the data suggests that while many algorithms can learn to achieve a similar *level* of cooperation as humans, their learning *dynamics* can differ significantly. Furthermore, the accuracy of their *predictions* about human cooperation varies, with some algorithms being more reliable predictors than others, despite achieving similar cooperation rates. The poor performance of LinUCB and UCB in both cooperation rate and prediction error warrants further investigation into their underlying mechanisms.
DECODING INTELLIGENCE...