\n
## Charts: Behavioral Cloning - Cooperation Rate & Prediction Error
### Overview
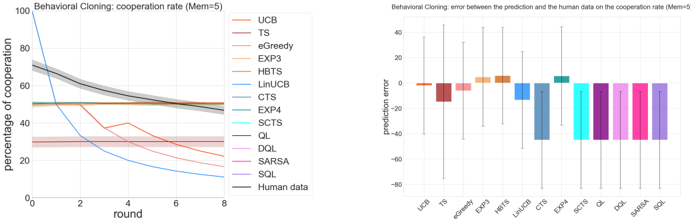
The image presents two charts related to behavioral cloning and cooperation rates. The left chart displays the percentage of cooperation over rounds for various algorithms and human data. The right chart shows the prediction error between the algorithms' predictions and the human data on the cooperation rate. Both charts specify a memory (Mem) value of 5.
### Components/Axes
**Left Chart:**
* **Title:** Behavioral Cloning: cooperation rate (Mem=5)
* **X-axis:** round (ranging from 0 to 8)
* **Y-axis:** percentage of cooperation (ranging from 0 to 100)
* **Algorithms (Legend):** UCB (orange), TS (red), eGreedy (brown), EXP3 (light brown), HBTS (light orange), LinUCB (yellow), CTS (cyan), EXP4 (light cyan), SCTS (turquoise), QL (blue), DQL (magenta), SARSA (pink), SQL (purple), Human data (dark gray)
**Right Chart:**
* **Title:** Behavioral Cloning: error between the prediction and the human data on the cooperation rate (Mem=5)
* **X-axis:** Algorithms (UCB, TS, eGreedy, EXP3, HBTS, LinUCB, CTS, EXP4, SCTS, QL, DQL, SARSA, SQL)
* **Y-axis:** prediction error (ranging from -80 to 40)
### Detailed Analysis or Content Details
**Left Chart:**
* **Human data (dark gray):** Starts at approximately 80% cooperation and decreases slightly to around 70% by round 8. The area around the line represents the standard deviation, showing a relatively stable cooperation rate.
* **UCB (orange):** Starts at approximately 60% and decreases rapidly to around 20% by round 8.
* **TS (red):** Starts at approximately 50% and decreases to around 30% by round 8.
* **eGreedy (brown):** Remains relatively flat around 40% throughout the rounds.
* **EXP3 (light brown):** Starts at approximately 50% and decreases to around 30% by round 8.
* **HBTS (light orange):** Starts at approximately 50% and decreases to around 30% by round 8.
* **LinUCB (yellow):** Starts at approximately 50% and decreases to around 30% by round 8.
* **CTS (cyan):** Starts at approximately 50% and decreases to around 30% by round 8.
* **EXP4 (light cyan):** Starts at approximately 50% and decreases to around 30% by round 8.
* **SCTS (turquoise):** Starts at approximately 50% and decreases to around 30% by round 8.
* **QL (blue):** Starts at approximately 50% and decreases to around 30% by round 8.
* **DQL (magenta):** Starts at approximately 50% and decreases to around 30% by round 8.
* **SARSA (pink):** Starts at approximately 50% and decreases to around 30% by round 8.
* **SQL (purple):** Starts at approximately 50% and decreases to around 30% by round 8.
**Right Chart:**
* **UCB:** Approximately -10 prediction error.
* **TS:** Approximately -5 prediction error.
* **eGreedy:** Approximately -25 prediction error.
* **EXP3:** Approximately -15 prediction error.
* **HBTS:** Approximately 0 prediction error.
* **LinUCB:** Approximately -20 prediction error.
* **CTS:** Approximately -10 prediction error.
* **EXP4:** Approximately -5 prediction error.
* **SCTS:** Approximately 0 prediction error.
* **QL:** Approximately -10 prediction error.
* **DQL:** Approximately 0 prediction error.
* **SARSA:** Approximately 0 prediction error.
* **SQL:** Approximately 10 prediction error.
### Key Observations
* The human data maintains a relatively high and stable cooperation rate throughout the rounds.
* Most algorithms show a decreasing cooperation rate over rounds.
* UCB exhibits the most significant decrease in cooperation rate.
* HBTS, SCTS, DQL, and SARSA have the lowest prediction errors, indicating they best predict human cooperation rates.
* eGreedy has the highest negative prediction error, suggesting it consistently underestimates human cooperation.
* SQL has a positive prediction error, suggesting it consistently overestimates human cooperation.
### Interpretation
The data suggests that the algorithms, with the exception of HBTS, SCTS, DQL, and SARSA, struggle to maintain a cooperation rate comparable to human behavior over time. The decreasing cooperation rates of most algorithms indicate a potential learning or adaptation issue. The prediction error chart highlights which algorithms are closest to replicating human behavior. The low prediction errors for HBTS, SCTS, DQL, and SARSA suggest these algorithms are better suited for modeling human cooperation in this scenario. The outliers, such as eGreedy and SQL, demonstrate significant discrepancies in their predictions, indicating a need for further refinement or alternative approaches. The consistent negative error for eGreedy suggests it is overly pessimistic, while the positive error for SQL suggests it is overly optimistic. The memory parameter (Mem=5) likely influences these results, and exploring different memory values could reveal further insights. The charts provide a comparative analysis of different behavioral cloning algorithms in a cooperative environment, offering valuable information for selecting and optimizing algorithms for similar tasks.