TECHNICAL ASSET FINGERPRINT
ea95236c793f060108d6615c
Click to view fullscreen
Press ESC or click to close
FOUND IN PAPERS
EXPERT: healer-alpha-free VERSION 1
RUNTIME: free/openrouter/healer-alpha
INTEL_VERIFIED
\n
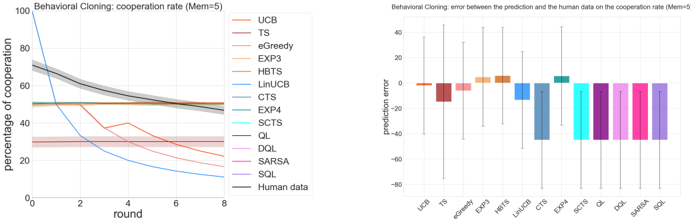
## Line Chart & Bar Chart: Behavioral Cloning Performance Analysis
### Overview
The image contains two side-by-side charts analyzing the performance of various reinforcement learning and multi-armed bandit algorithms in a "Behavioral Cloning" task with a memory parameter (Mem=5). The left chart tracks the cooperation rate over time (rounds), while the right chart quantifies the prediction error of each algorithm compared to human data.
### Components/Axes
**Left Chart: Line Chart**
* **Title:** "Behavioral Cloning: cooperation rate (Mem=5)"
* **X-Axis:** Label: "round". Scale: Linear, from 0 to 8 with major ticks at 0, 2, 4, 6, 8.
* **Y-Axis:** Label: "percentage of cooperation". Scale: Linear, from 0 to 100 with major ticks at 0, 20, 40, 60, 80, 100.
* **Legend:** Positioned on the right side of the chart. Contains 14 entries, each with a colored line sample and a label:
* UCB (Light Orange)
* TS (Dark Red)
* eGreedy (Pink)
* EXP3 (Light Orange)
* HbTS (Brown)
* LinUCB (Light Blue)
* CTS (Dark Blue)
* EXP4 (Cyan)
* SCTS (Dark Purple)
* QL (Purple)
* DQL (Pink)
* SARSA (Magenta)
* SQL (Light Purple)
* Human data (Thick Gray Line)
**Right Chart: Bar Chart**
* **Title:** "Behavioral Cloning: error between the prediction and the human data on the cooperation rate (Mem=5)"
* **X-Axis:** Labels corresponding to the algorithm names from the left chart's legend, listed in the same order from left to right: UCB, TS, eGreedy, EXP3, HbTS, LinUCB, CTS, EXP4, SCTS, QL, DQL, SARSA, SQL.
* **Y-Axis:** Label: "prediction error". Scale: Linear, from -80 to 40 with major ticks at -80, -60, -40, -20, 0, 20, 40.
* **Data Series:** 13 vertical bars (one for each algorithm except "Human data"), each colored to match its corresponding line in the left chart. Each bar has a black vertical error bar extending above and below the top of the bar.
### Detailed Analysis
**Left Chart - Cooperation Rate Trends:**
* **Human Data (Gray Line):** Starts at approximately 70% cooperation at round 0. Shows a steady, near-linear decline, ending at approximately 50% at round 8.
* **High Initial, Rapid Decline:** The UCB (light orange) and LinUCB (light blue) lines start very high (near 100% and ~90% respectively) but drop sharply within the first 2-3 rounds, ending below 20%.
* **Moderate Initial, Gradual Decline:** Several algorithms (e.g., HbTS-brown, CTS-dark blue, EXP4-cyan) start between 60-70% and decline gradually, generally staying above the Human data line until later rounds.
* **Low and Stable:** The eGreedy (pink) and TS (dark red) lines start low (around 30%) and remain relatively flat throughout all 8 rounds.
* **Clustered Group:** A group of algorithms (QL-purple, DQL-pink, SARSA-magenta, SQL-light purple, SCTS-dark purple) start around 50-60% and show a very gradual decline, tightly clustered together and ending near 40-50%.
**Right Chart - Prediction Error:**
* **Positive Error (Over-prediction):** UCB, EXP3, HbTS, and EXP4 have positive mean errors, indicating their predicted cooperation rates were, on average, higher than the human data. EXP4 has the largest positive error (~+8).
* **Negative Error (Under-prediction):** All other algorithms have negative mean errors. The largest magnitude errors (most negative) are for LinUCB (~-35), CTS (~-45), and the clustered group (QL, DQL, SARSA, SQL) ranging from ~-50 to ~-60.
* **Error Bars:** All bars have substantial error bars, indicating high variance in the prediction error across rounds or trials. The error bars for LinUCB, CTS, and the clustered group are particularly large, spanning 40-60 units.
### Key Observations
1. **Human Benchmark:** The human cooperation rate provides a clear, decaying benchmark. Most algorithms fail to replicate this smooth decay pattern.
2. **Two Failure Modes:** Algorithms exhibit two distinct failure modes relative to human data: 1) Starting too high and collapsing (UCB, LinUCB), or 2) Starting too low and remaining flat (eGreedy, TS).
3. **Clustered Performance:** A distinct group of value-based RL algorithms (QL, DQL, SARSA, SQL) produce nearly identical, moderately decaying cooperation rate trajectories.
4. **Error-Correlation:** Algorithms with the most visually divergent lines from the human data in the left chart (e.g., LinUCB, CTS, the QL cluster) correspond to the largest magnitude (negative) errors in the right chart.
5. **High Variance:** The large error bars on the right chart suggest significant instability or sensitivity in the algorithms' predictions across different conditions or runs.
### Interpretation
This analysis evaluates how well various decision-making algorithms can clone or predict human cooperative behavior in a sequential interaction (rounds). The "Mem=5" parameter suggests the task involves a memory component.
The data demonstrates that simply matching the *average* cooperation rate is insufficient. The **trend** is critical. The human data shows a strategic, gradual reduction in cooperation over time. Most algorithms fail to capture this dynamic:
* **Overly Aggressive Starters (UCB, LinUCB):** These likely exploit too aggressively early on, leading to a rapid breakdown in cooperation, a pattern not seen in the human data.
* **Overly Conservative Starters (eGreedy, TS):** These fail to establish high initial cooperation, suggesting an inability to model the early-phase trust or strategy of the human participants.
* **The RL Cluster (QL, etc.):** Their similar performance suggests a common underlying limitation in value-based methods for this specific cloning task, possibly an inability to model the non-stationary or opponent-aware aspects of human strategy.
* **Best Visual Fit:** Algorithms like HbTS or EXP4, which start near the human level and decay, though not perfectly, appear to be the most successful at capturing the qualitative trend, despite having a positive mean error (which may be due to overestimation in later rounds).
The high variance (large error bars) indicates that the performance of these algorithms is not robust. The investigation suggests that future work should focus on algorithms that can model the **temporal dynamics** of human cooperation, not just static rates, and that reduce prediction variance. The clear separation of algorithm families by their visual trajectories and error profiles provides a diagnostic tool for selecting or developing models for human behavior cloning.
DECODING INTELLIGENCE...